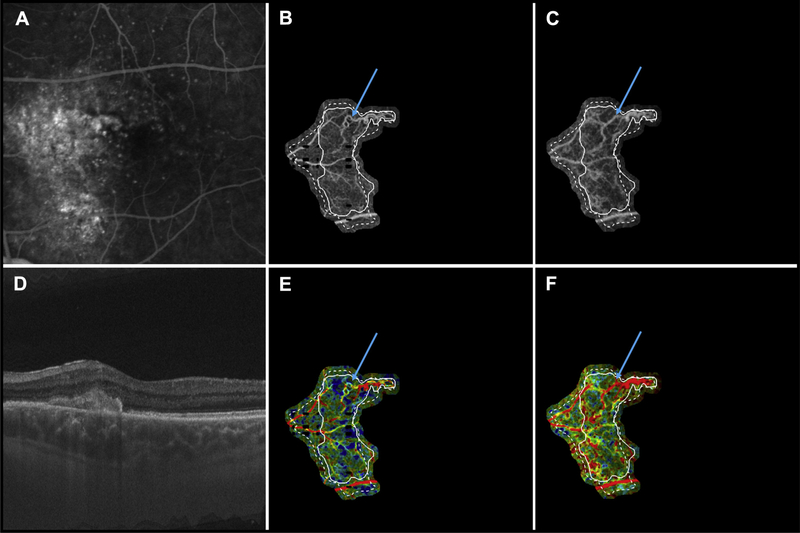
Figure 3.
Multimodal longitudinal imaging of chronic choroidal neovascularization (CNV) in patient 7. Images were obtained 21 months apart. A, Fluorescein angiography image cropped to same area as the OCT angiography (OCTA) image. B, Optical coherence tomography angiography image of CNV at the initial visit, when the patient’s visual acuity was 20/100. C, Optical coherence tomography angiography image of CNV at the follow-up visit, when the patient’s visual acuity was 20/25. D, Optical coherence tomography B-scan at the follow-up visit. E, Variable interscan time analysis (VISTA) OCTA image of CNV at the initial visit. F, Variable interscan time analysis OCTA of CNV at the follow-up visit. Solid lines correspond to the CNV boundary at the initial visit, and dashed lines correspond to the CNV boundary at the follow-up visit. Note the expansion of the CNV vasculature between the initial and follow-up visits. Note that the expansion of vasculature is accompanied by an increase in high flow-speed characteristics (red in the VISTA OCTA images). Blue arrows point to a region of a vessel that was tortuous, with slow flow speed (yellow in the VISTA OCTA images) in the initial visit, but has straightened and acquired high speed flow (red in the VISTA OCTA images) in the follow-up visit.

