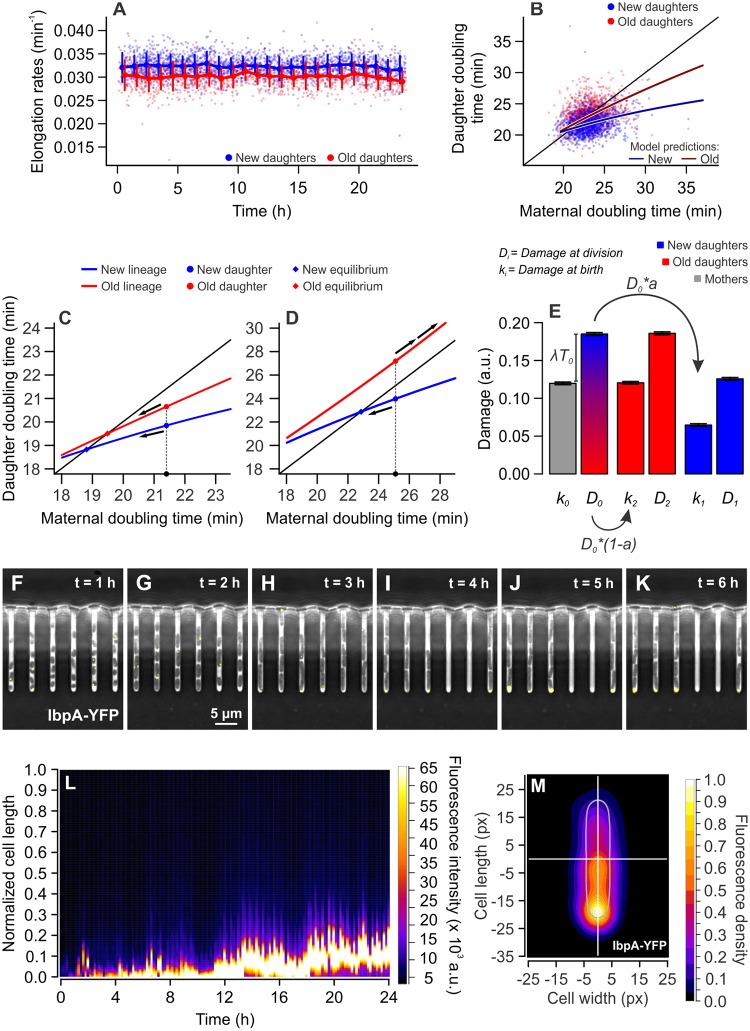
Fig 1. Maintenance of growth equilibrium and immortality through asymmetric damage partitioning.
(A) New daughters (n = 1,782; 0.032 ± 0.0023 min−1 [mean ± SD]) elongated at significantly higher rates than old daughters (n = 1,285; 0.030 ± 0.0025 min−1 [mean ± SD]), a distinction that remained stable over several hours (one-tailed t test, t = 24.747, df = 2,612.5, p < 0.001). Binned data comprise mean ± SD. (B) The distinction between new and old daughters was also verified for the doubling times of sibling pairs (paired one-tailed t test, t = 24.716, df = 1,383, p < 0.001; S1 Data). The separation of new and old subpopulations, according to the estimation of growth parameters (see Materials and methods), was produced by the accumulation of damage at a rate λ = 0.0028 min−1, and the partitioning of such load with asymmetry a = 0.375. (C and D) Model predictions on cellular aging with Π = 18 min, a = 0.4. (C) With λ = 0.002 min−1, asymmetry produces a separation between new (blue) and old (red) subpopulations. The intersection of model predictions and the identity line creates equilibrium points, where T0 = T1 or T0 = T2, to which new or old daughters converge over generations (arrows). (D) With λ = 0.008 min−1, the old lineages are predicted to lose equilibrium and arrest division. New daughters, through constant rejuvenation, would retain replicative immortality at the same damage levels. (E) Damage load harbored by a mother and its daughters at the time of birth (k0, k1, k2) and division (D0, D1, D2; S7 Data). Applying the average growth parameters Π and λ to calculate k1 and k2, we verified that old daughters inherit larger damage loads than new daughters (paired one-tailed t test, t = 27.988, df = 1,244, p < 0.001) and also bear more damage at the time of division (paired one-tailed t test, t = 27.914, df = 1,244, p < 0.001). Bars represent mean ± SE. (F to K) Time lapse microscopy images showing the accumulation of misfolded proteins at the old cell poles over time. The small chaperone IbpA (yellow dots) colocalizes with damaged proteins, allowing the visualization of protein aggregates. (L) The fluorescence profile of an old lineage expressing IbpA-YFP shows that a protein aggregate develops over time, remaining trapped in the old pole over generations. Fluorescence profiles were measured every 10 min. See also S1 Fig for non-normalized length. (M) Combined IbpA-YFP fluorescence heatmap of 428 old daughters at the bottom of mother machine wells, imaged over 6 h. a.u., arbitrary units; IbpA, inclusion body protein A; YFP, yellow fluorescent protein.

