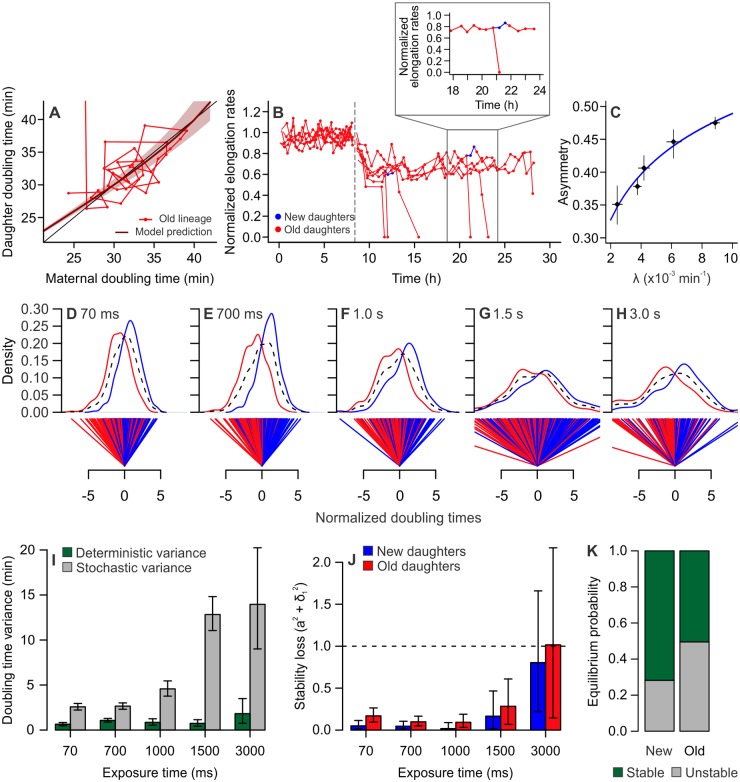
Fig 4. Damage accumulation leads to mortality and disrupted asymmetry.
All panels depict MG1655 wild-type E. coli. (A) Doubling times of an old lineage as it accumulates damage at λ = 0.009 min−1, induced by 3 s of light exposure. The line representing model predictions (dark red) approaches identity (black), indicating that these cells do not reach equilibrium. After a few generations, the last daughter in the lineage arrests growth, which equals an infinite doubling time, which represents the crossing of a mortality threshold for the lineage. (B) Elongation rates of old lineages, showing the transition from control imaging (0–8.6 h) to the infliction of 3 s of light exposure every 2 min. All cells exhibited lower growth rates, culminating in division arrest for old daughters. New daughters outlived their old siblings by at least one generation and were sometimes able to generate a new lineage in the growth wells (shown in blue and expanded in the detail). All values were normalized by the average control elongation rates. (C) Increasing damage accumulation rates disrupted asymmetric partitioning, as shown by the asymmetry coefficient approaching 0.5 (a = 0.1007 × ln(λ) + 0.95, p < 0.001). Points represent average growth parameters and 95% CIs (S7 Data). (D–H) Distributions of new (blue) and old (red) daughter doubling times were normalized around a symmetric midpoint. Whereas the combined population has a distribution centered at zero (dashed black lines), new and old subpopulations split into 2 separate distributions. The distance between the averages of these distributions expresses the doubling-time variance produced by deterministic physiological asymmetry. The average variance of new and old distributions around their own means, on the other hand, represents the variance produced by stochasticity. (I) Deterministic and stochastic portions of the variance from (D–H) were summarized for increasing light exposure, showing an increase in stochasticity. Error bars represent 95% CIs. (J) Our stability analysis indicated that new and old daughters remained in stable equilibrium until exposed to 3 s of phototoxic stress. At 3 s, old daughters no longer satisfy the stability requirement (a2 + σ12 = 1.016), thus transitioning to a mortal state. Error bars represent 95% CIs (S7 Data). (K) At 3 s of exposure, old lineages displayed a 50.24% probability of losing equilibrium, whereas new lineages exhibited only a 28.10% probability of mortality (test for equality of proportions, x2 = 1027.7, df = 1, p < 0.001). CI, confidence interval.

