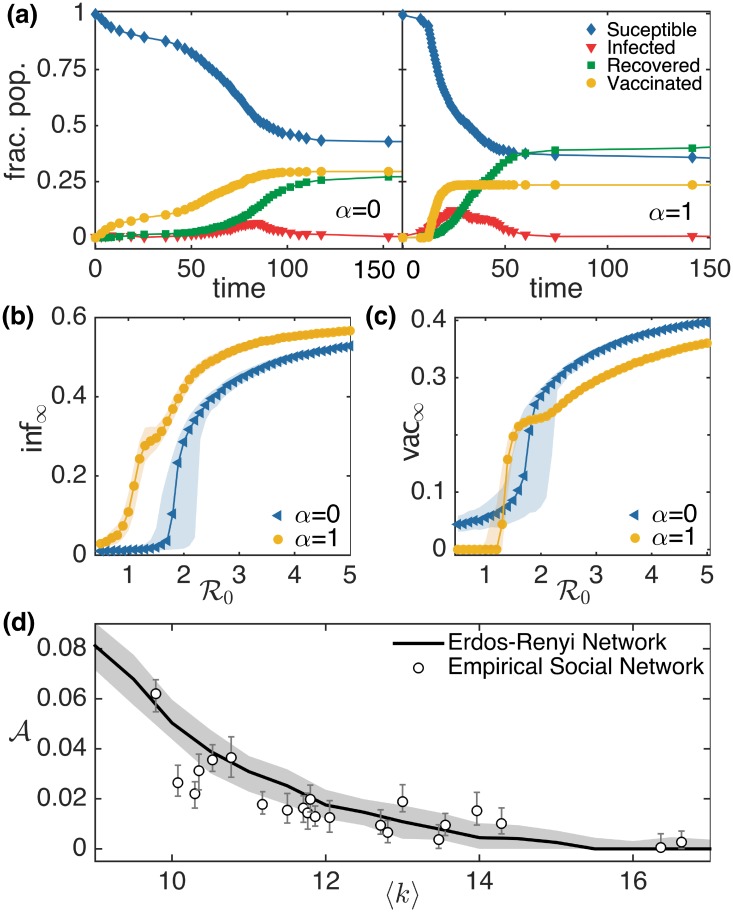
Fig 3. Simulation results for the co-evolution of epidemic spreading and vaccine uptake behavior in Erdős-Rényi networks.
(a) A sample time series showing the evolution of S, I, R and V for a simulated epidemic with β = 0.02 and τI = 10 in random networks with N = 1024 and 〈k〉 = 10 is displayed for α = 0 (left) and α = 1 (right). We display a comparison of the final fraction of agents that are (b) infected inf∞ and (c) vaccinated vac∞ during a simulated epidemic with different values of , for α = 0 and α = 1. Each point represents the median of 1000 simulation runs and the patches indicate the corresponding IQR. (d) Dependence of crossover area on average node degree 〈k〉 behaves similarly in empirical social networks and model random networks. The solid line and patch shows the median and IQR of the 1000 simulated epidemics on Erdős-Rényi networks respectively. The circle and error bars represent the median and IQR of the 1000 simulated epidemic on social network of villages in southern India that have a largest connected component greater than 1000.

