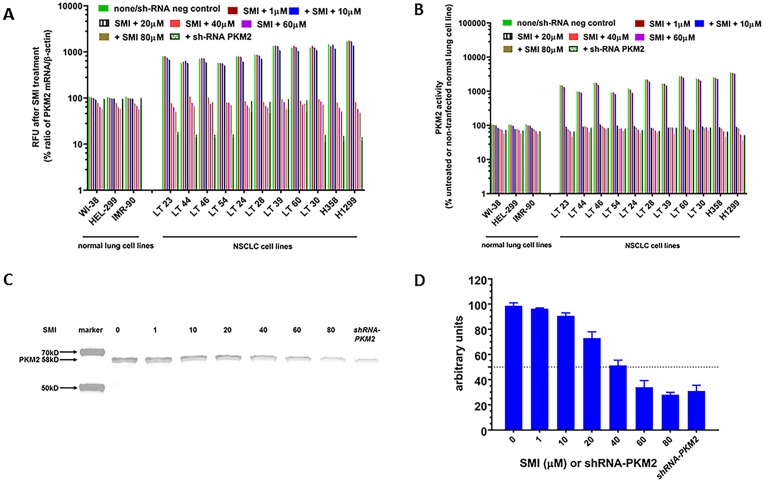
Fig 2. Effect of SMI on mRNA expression, enzyme activity and protein expression by Western blot analysis.
Three normal lung and 11 NSCLC cell lines were treated with different concentrations of PKM2 inhibitor (10 to 80 μM). (A) Total RNA from the cells was extracted and real-time PCR was performed. Relative expression of mRNA for PKM2 and β-actin is shown as mean % of untreated normal lung cell line (Relative Fluorescence Units-RFU). (B) PKM2 enzyme activity was measured. Each value is expressed as mean % of untreated normal lung cell lines. (C) Expression of PKM2 in one representative NSCLC cell line treated with different concentration of SMI and shRNA-PKM2 was determined by Western blot analysis. (D) Semi-quantitation of immunoblot was performed using image studio software. Dotted line indicated 50% arbitrary units of band intensity.

