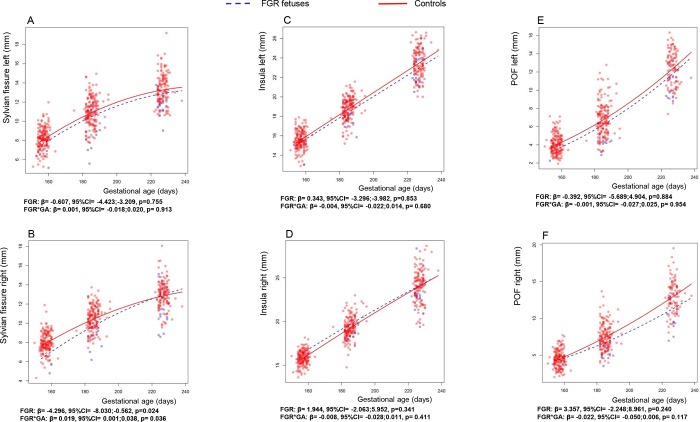
Fig 2. Trajectories of fetal brain fissure depths of FGR and controls.
Data points and regression lines are depicted for the mean trajectories of the three brain fissures of FGR fetuses (blue) and controls (red) as a function of gestational age in days corresponding to the multivariate linear mixed models (model 2). Beta values FGR (growth) correspond to the mean difference between the FGR trajectories compared to controls. Beta values of FGR*GA (growth rate) correspond to the difference in mean slope per day gestational age of the FGR trajectory compared to controls. POF, Parieto-occipital fissure; FGR, fetal growth restriction; GA, gestational age; β, beta value, 95%CI, ninety-five percent confidence interval; p, p-value.

