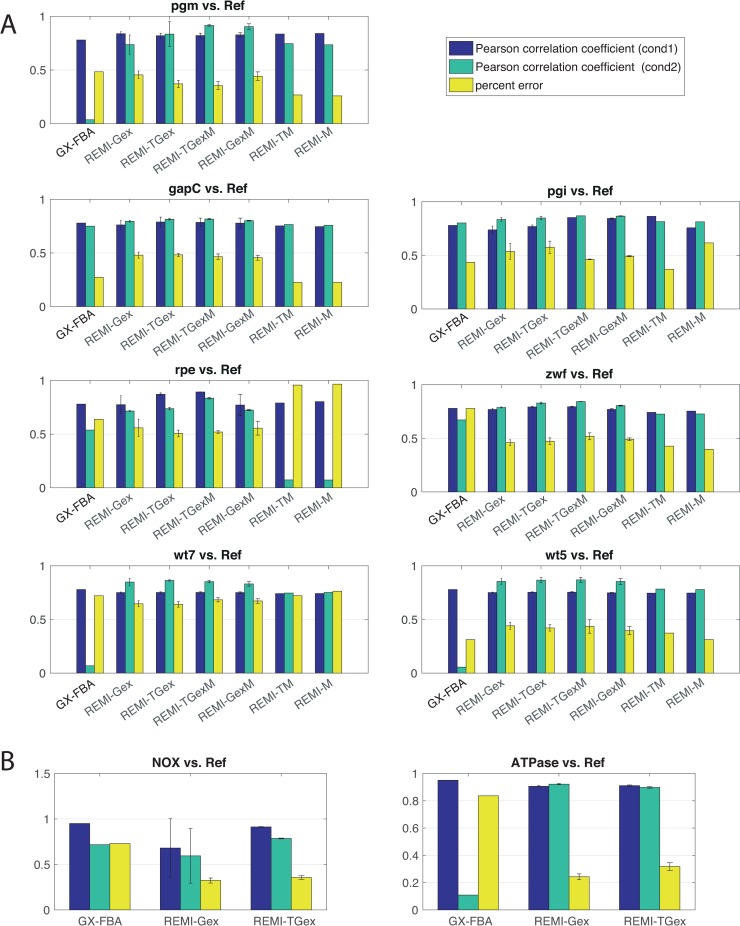
Fig 3. The comparison of steady-state fluxes between GX-FBA and REMI.
The blue bar represents the Pearson correlation coefficient (PCC) between the experimental fluxes and predicted fluxes for the wildtype or reference state and the green bar represents the PCC for the mutant or overexpressed state. The third bar denotes the average percentage error between the experimental fluxes and predicted fluxes. Error bars (available only for the REMI method) represent the standard error of the mean of the alternative solutions. (A) The comparison between the mutant and wildtype for the pgm, pgi, gapC, zwf, and rpe mutants as well as the comparison of the wildtype at growth rates of 0.5 hour-1 (wt5) and 0.7 hour-1 (wt7) compared to a reference wildtype with a 0.2 hour-1 growth rate (Ref). (B) The comparison of NOX overexpression and ATPase overexpression against the wildtype.

