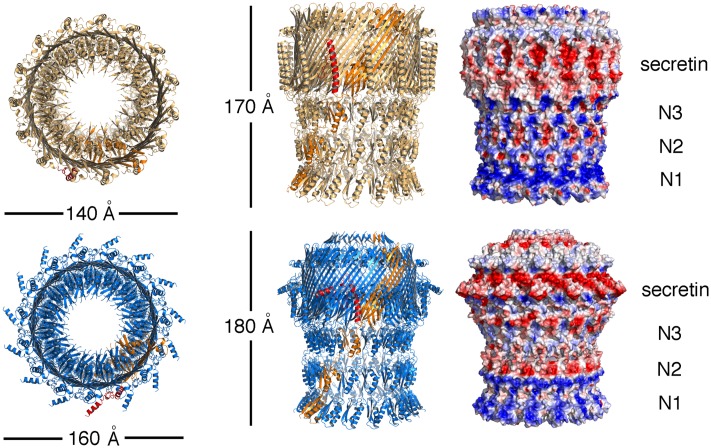
Fig 4. Models of ExeD (top) and EpsD (bottom).
Fifteen monomers form each one of the structures, and in both cases one monomer is colored in orange. The S-domain of the same monomer is indicated in red. (Right) Surface potentials of ExeD and EpsD, where blue and red colors represent basic and acidic residues, respectively. The membrane-binding region, in addition to a hydrophobic belt (white), also displays an acidic region formed mostly by residues from the S domain. In both cases, due to high flexibility in the N-terminal region, fitting was guided by the GspD models [11].

