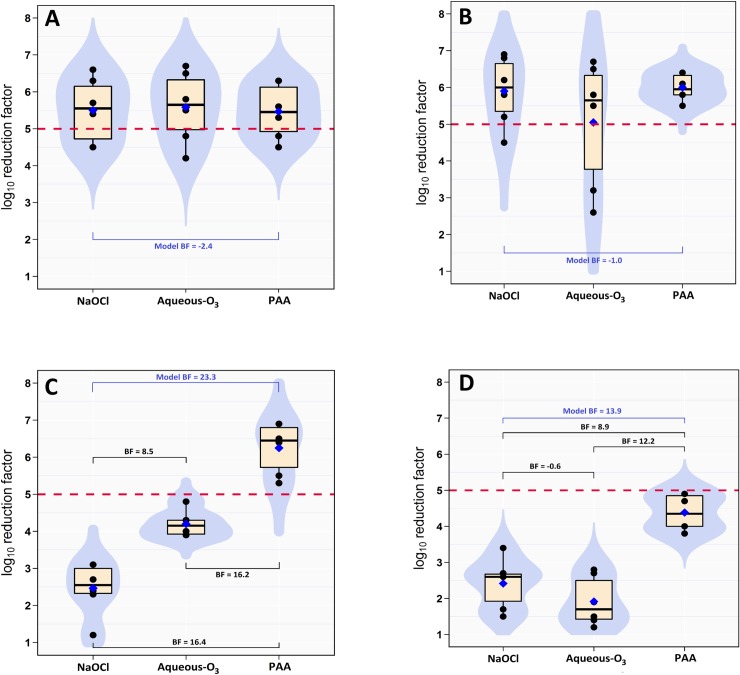
Fig 2. Boxplot of log10 reduction in Salmonella cell count on substrate surfaces.
(A) plastic, (B) nylon, (C) rubber, and (D) wood substrates contaminated with Salmonella Typhimurium-Choleraesuis and treated with 50 mL of 200 ppm sodium hypochlorite (NaOCl), 9 ppm of aqueous ozone (aqueous-O3), or 400 ppm peracetic acid (PAA) for 4 minute exposure. The horizontal dashed red line indicates the safe level reduction (5-log10). The blue diamond indicates the posterior mean. The light blue shapes indicates the violin density plot.

