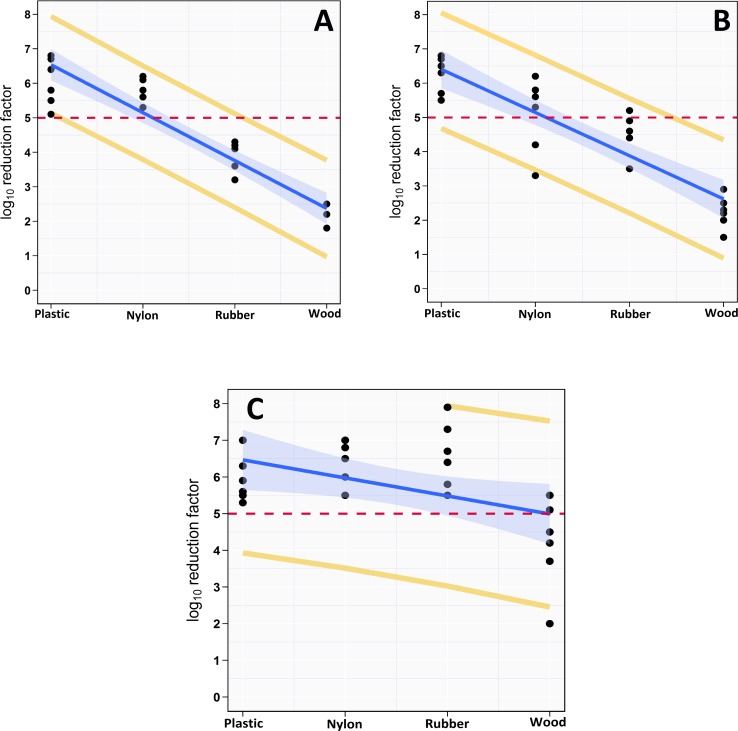
Fig 4.
Scatterplot of the linear relationship between materials (surface complexity) contaminated with Salmonella Typhimurium-Choleraesuis and rate of bacterial reduction of sodium hypochlorite (A), aqueous ozone (B), and peracetic acid (C). The solid blue line is the regression line calculated from the posterior predictive distributions, the shaded region indicates 95% credible interval, and the yellow line is the 95% posterior predicative intervals. The horizontal dashed red line indicates 5-log10 reduction.

