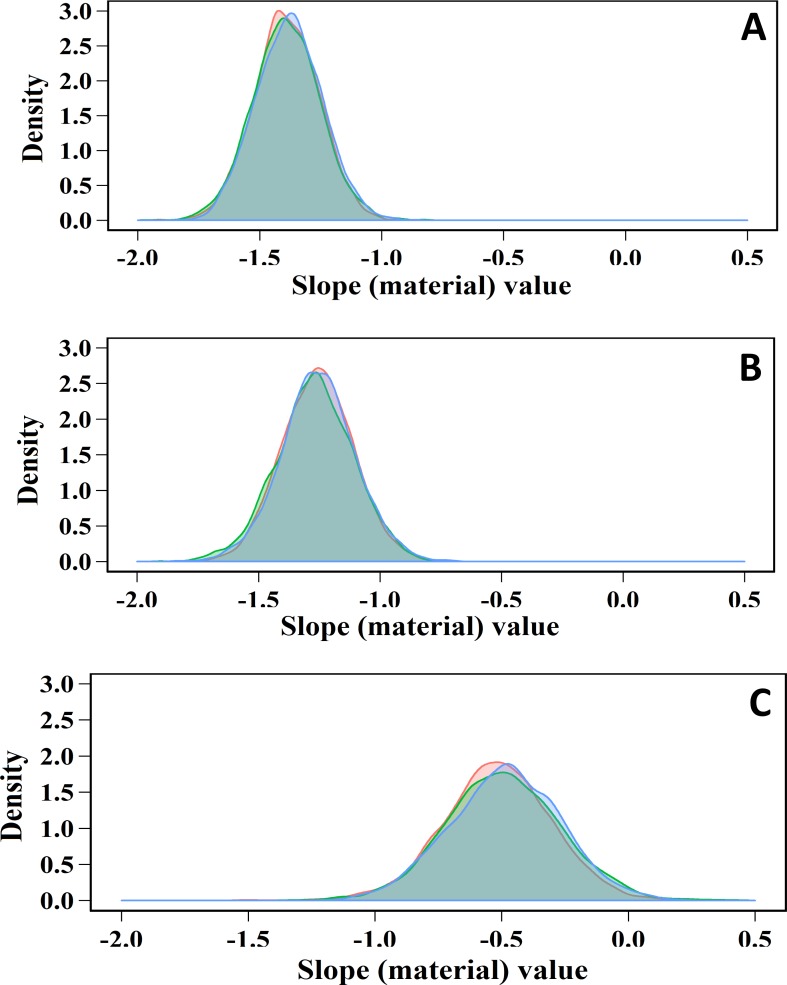
Fig 5.
Posterior density plots of the slope coefficients of sodium hypochlorite (A), aqueous ozone (B), and peracetic acid (C) obtained from the fitted Bayesian linear regression models using the type of surface as a predictor for Salmonella Typhimurium-Choleraesuis reduction. Three different colors of the density curves indicate the number of chains. The density plot away from zero indicates the significance of the effect, where zero indicates no effect of surface type on the killing power of the disinfectant.

