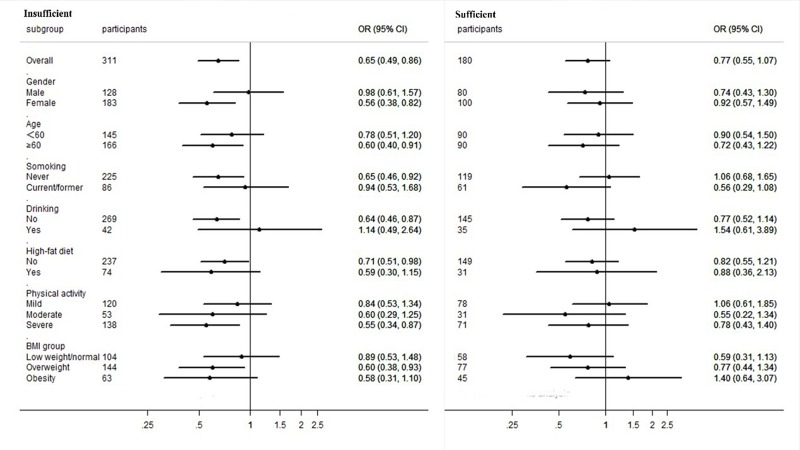
Fig 3. Adjusted OR (95%CI) for CVD in subgroup analysis.
Subgroup analysis of serum 25(OH)D levels and risk of CVD. Circles represent the ORs, horizontal bars represent 95% CI. Adjusted for the covariates of age, gender, education, smoking, alcohol drinking, high-fat diet, physical activity, BMI groups and T2DM (model 3).

