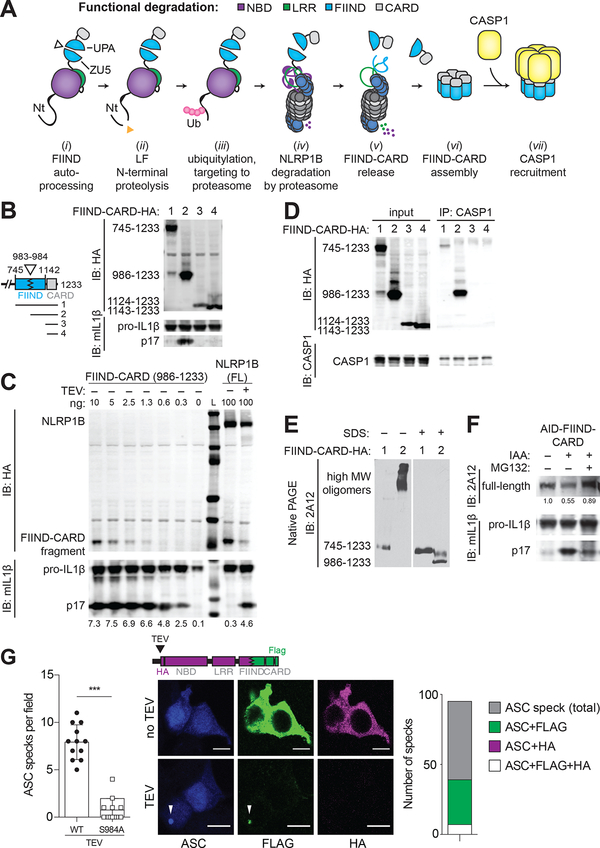
Fig. 3. NLRP1B is activated by “functional degradation”.
(A) A model for NLRP1B activation via “functional degradation”: (i) constitutive auto-processing of the NLRP1B FIIND domain results in two non-covalently associated polypeptides: NBD–LRR–FIIND(ZU5) and FIIND(UPA)–CARD; (ii) Lethal factor (LF) protease cleavage of the NLRP1B Nt exposes a neo-Nt; (iii) N-end rule factor recognition of the neo-Nt results in ubiquitylation of NLRP1B; (iv) NLRP1B is degraded by the proteasome, resulting in (v) release of the FIIND(UPA)–CARD fragment; (vi) The FIIND(UPA)–CARD fragment self-assembles into a high molecular weight oligomer which (vii) serves as a platform for CASP1 maturation and downstream inflammasome signaling. (B) The ability of the indicated C-terminal HA-tagged expression constructs to induce inflammasome activity was tested in 293T cells as in Fig. 1. (C) 293T cells were transfected with the indicated amounts (ng) of plasmid encoding HA-tagged FIIND(UPA)–CARD fragment (left) or full-length (FL) NLRP1B (± co-transfected TEV protease) and inflammasome activation was measured as in Fig. 1. L, Ladder of protein molecular weight standards. (D) 293T cells were transfected with CASP1 and HA-tagged constructs as depicted in (B). Lysates were immunoprecipitated (IP) with anti-CASP1 and immunoblotted (IB) as indicated. (E) 293T cells were transfected with CASP1 and HA-tagged constructs as depicted in (B) and analyzed by native PAGE and immunoblot with anti-NLRP1B antibody (2A12). Proteins were native or denatured with sodium dodecyl sulfate (SDS) as indicated. (F) 293T cells were transfected with an expression construct encoding AID-FIIND(ZU5+UPA)–CARD and treated with IAA or MG132 as indicated. Relative band intensities are shown. Gel images are representative of experiments performed at least three times for (B, D, E, F) or a single (C) experiment is shown. (G) 293T cells were transfected with expression constructs for ASC (blue) and TEV-cleavable NLRP1B encoding a C-terminal FLAG (green) tag and HA (magenta) tag (inserted after the TEV site, as shown). The number of ASC specks per field (+/− SD) was quantified for TEV-treated samples, compared to cells expressing a S984A FIIND auto-processing NLRP1B mutant. Representative images depict cytosolic FLAG and HA signal in untreated samples, with FLAG colocalization with ASC specks (white arrows) and concomitant loss of the HA signal in TEV-expressing cells. The total number of ASC specks, or ASC specks positive for both FLAG and HA (n=7) or only FLAG (n=32) or HA (n=0) in TEV-treated samples is quantified from 12 fields from three independent experiments. Scale bar, 10 microns. Significance was determined by student’s t-test ***, P < 0.001.

