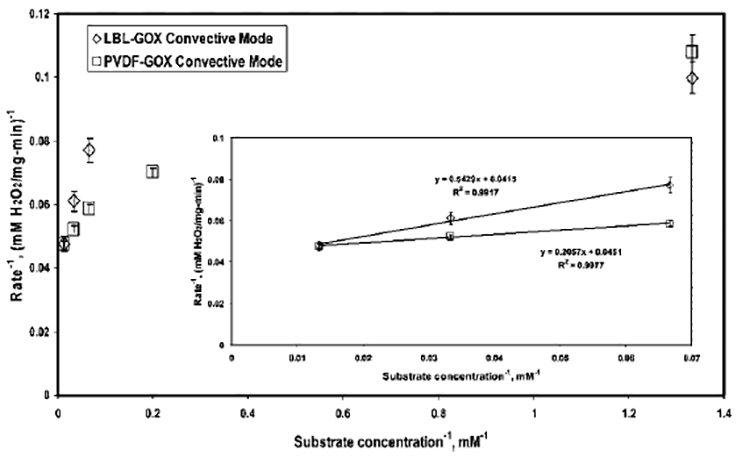
Figure 7.

Lineweaver–Burke plot for GOX immobilized in functionalized LBL (LBL-GOX-convective) and PVDF (PVDF-GOX-convective) membranes. Conditions: concentration of glucose solution, 0.75–75 mM (1/S = 1.33–013 mM−1); amount of GOX immobilized, 1.5 and 1.8 mg for LBL and PVDF membranes, respectively; temperature, 25 °C; pH of NaOAc–HCl buffer, 5.5. Inset shows the Lineweaver–Burke plot for a substrate concentration range of 15–75 mM (1/S = 0.067–0.013 mM−1).
