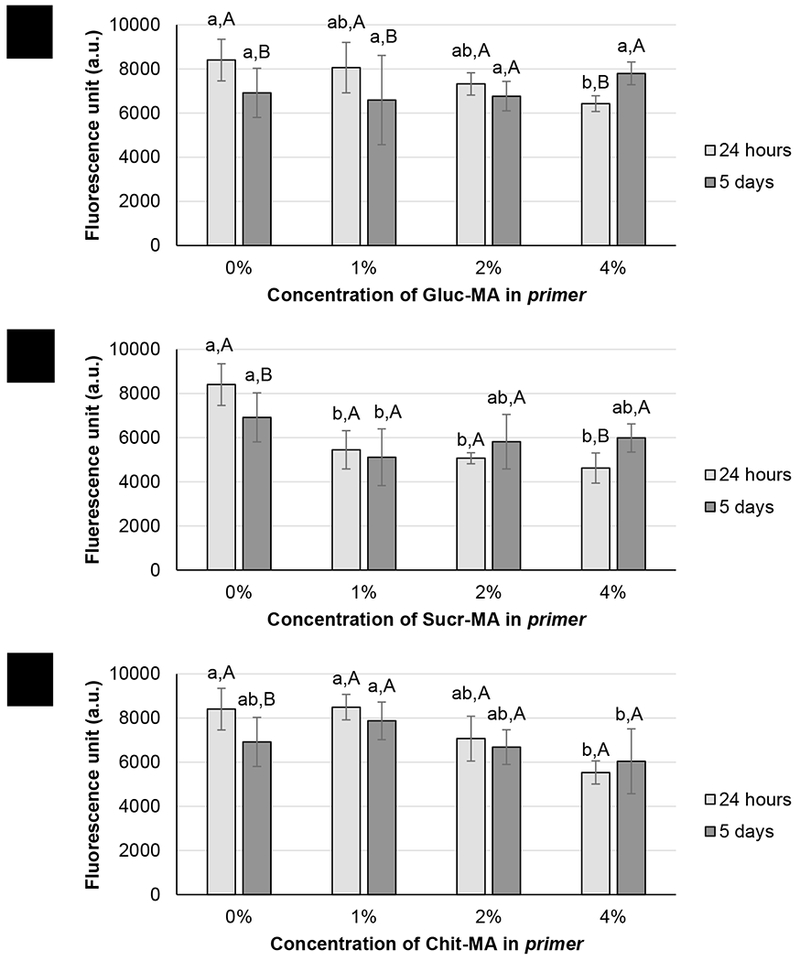
Figure 9.

Metabolic activity of Streptococcus mutans for primer groups containing (a) Gluc-MA, (b) Sucr-MA and (c) Chit-MA, after 24 hours and 5 days of incubation. The vertical lines indicate standard deviations. Different lower case letters indicate statistical differences between the groups for the same period of growth; different capital letters indicate statistical differences between 24 h and 5 days of growth within the same group.
