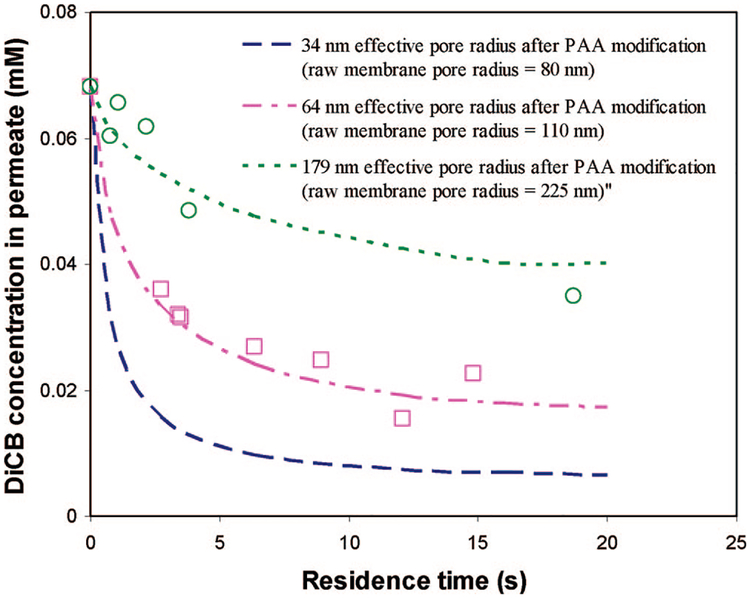
Figure 16.
Modeling and experimental results of the effect of membrane pore size on the dechlorination under convective flow. Plot of the molar concentration of DiCB in the PAA/PVDF membrane reactor outlet with different membrane pore sizes at difference residence times. Fe/Pd (Pd = 2.3 wt %) nanoparticle loading in the PAA layer is the same: 0.15 g cm−3. Note: the symbols represent the experimental data, while the lines represent model prediction.

