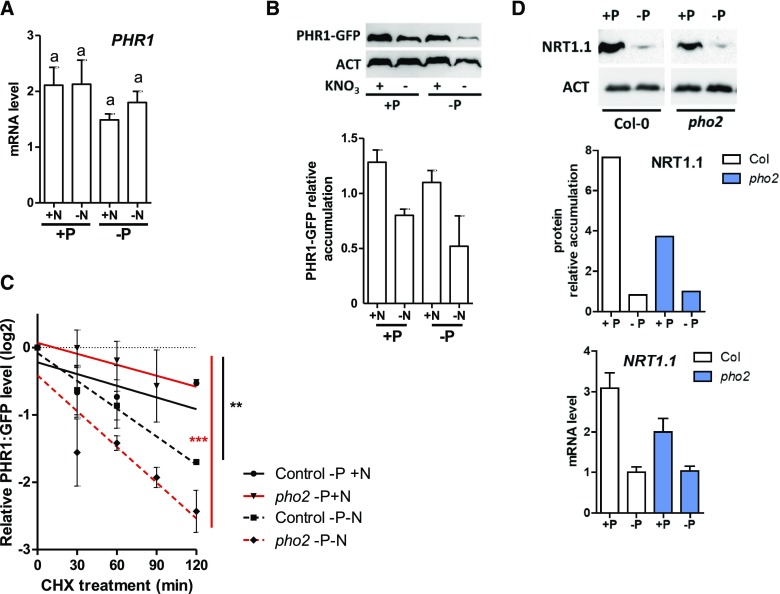
Figure 6.
N Influences PHR1 Accumulation and Turnover; Phosphate via PHO2 Affects NRT1.1 Protein Accumulation.
(A) PHR1 mRNA accumulation in N and P varying conditions. Experimental conditions correspond to those described in Figure 3A. None of the responses display a significant difference.
(B) PHR1-GFP immunoblot and quantification relative to actin in three independent experiments. ACT, actin.
(C) PHR1-GFP turnover (following CHX treatment) is measured in the wild-type and pho2 genetic backgrounds in +N or −N conditions. This is a compilation of three independent experiments. Comparison of linear models to zero were performed using analysis of covariance (Prism, GraphPad [**P < 0.01; ***P < 0.001]).
(D) NRT1.1 immunoblot in response to P starvation in the wild-type and pho2-1 genetic backgrounds. NRT1.1 protein quantification and mRNA level in the same conditions. Uncropped version of the blot showing the bands on the same membrane are provided Supplemental Figure 6. Col-0, Columbia-0 (wild type).

