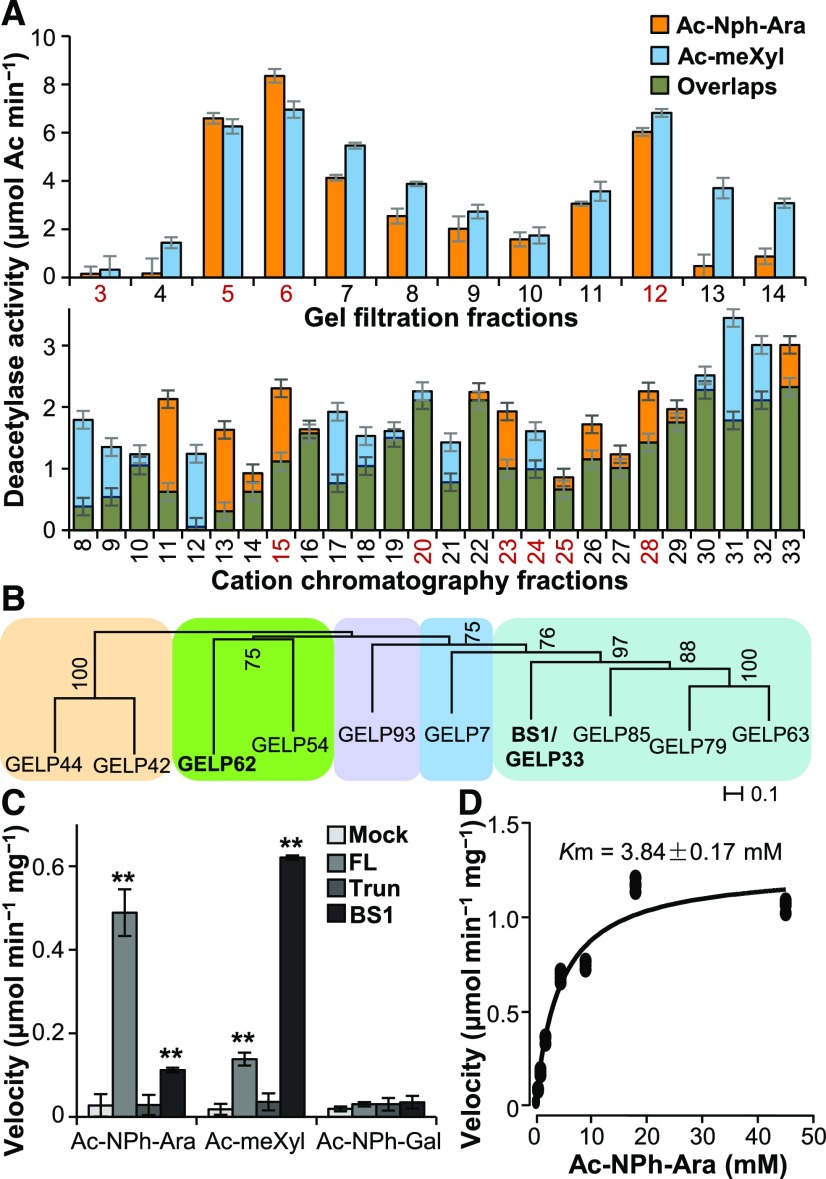
Figure 1.
Identification of Arabinoxylan Deacetylates.
(A) Deacetylase activity analysis of the protein fractions separated on a gel filtration Superdex 200 column (upper) and a cation-exchange chromatography HiTrap SP column (lower). The proteins present in the fractions numbered in red were separated by SDS-PAGE and digested with trypsin. The tryptic fragments were subjected to LC–MS analysis. Error bars = mean ± SD of three replicates of assays with independent proteins. **P < 0.01 by Welch’s unpaired t-test.
(B) Phylogenetic analysis of the GELPs identified by LC–MS. Bootstrap percentages are shown at the nodes. Color blocks sequentially label the IVd, Ix, Id, Ia, and Ib clades of the GELP family from left to right (Volokita et al., 2011; Chepyshko et al., 2012). “Ix” indicates the unclustered members of subfamily I.
(C) Quantification of deacetylase activities on acetylated sugars. One microgram of purified recombinant FL- and Trun-GELP62 (FL and Trun) and BS1 was incubated with 5 mM of Ac-meXyl, Ac-NPh-Ara, or Ac-NPh-Gal substrate. “Mock” represents the negative controls in the absence of recombinant proteins. Error bars = mean ± SD of three replicates of assays with independent proteins. **P < 0.01 by Welch’s unpaired t-test.
(D) Determination of the Km value of FL-GELP62 for the Ac-NPh-Ara substrate using a Michaelis–Menten plot. The Km value represents the mean of three replicates of assays with independent proteins.

