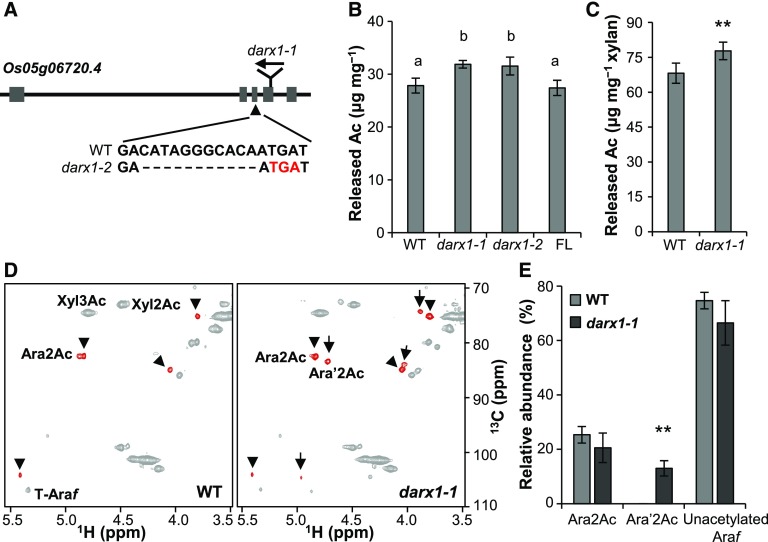
Figure 2.
Isolation and Characterization of the darx1/gelp62 Mutants.
(A) Schematic of DARX1 gene structure and the mutation sites of the indicated mutants. The boxes and lines in the diagram indicate exons and introns, respectively. The arrow indicates the insertion of the Tos17 transposon. The arrowhead indicates a deletion mutation in darx1-2 that results in a premature translational stop codon (red letters).
(B) The acetyl ester content in the cell-wall residues of mature internodes. Error bars = mean ± SD (for three b biological replicates of pooled internodes). The letters “a” and “b” indicate statistically significant differences according to the variance analysis and Tukey’s test (P < 0.05). WT, wild type; FL, full-length DARX1.
(C) Measurement of the acetyl ester level in the acetyl–xylan extracted from the wild-type and darx1-1 mature internodes. Error bar = mean ± sd (for three biological replicates of pooled internodes). **P < 0.01 by Welch’s unpaired t test. WT, wild type.
(D) Representative HSQC spectra of acetyl–xylan of wild-type and darx1-1 plants. Signals of acetylated arabinosyl residues are in red. Arrowheads and arrows indicate Ara2Ac and Ara′2Ac, respectively. The chemical shifts of Ara2Ac, O-2 acetylated arabinosyl residues and Ara′2Ac, O-2 acetylated arabinosyl residues on the O-2 acetylated xylosyl backbone, are described in Supplemental Table 2. WT, wild type.
(E) Quantification of arabinosyl residues in the wild-type and mutant acetyl–xylan based on examinations of HSQC spectra. The data are expressed as the abundance relative to the total Ara signals. Error bars = mean ± sd (for three biological replicates of pooled internodes). **P < 0.01 by Welch’s unpaired t test. WT, wild type.

