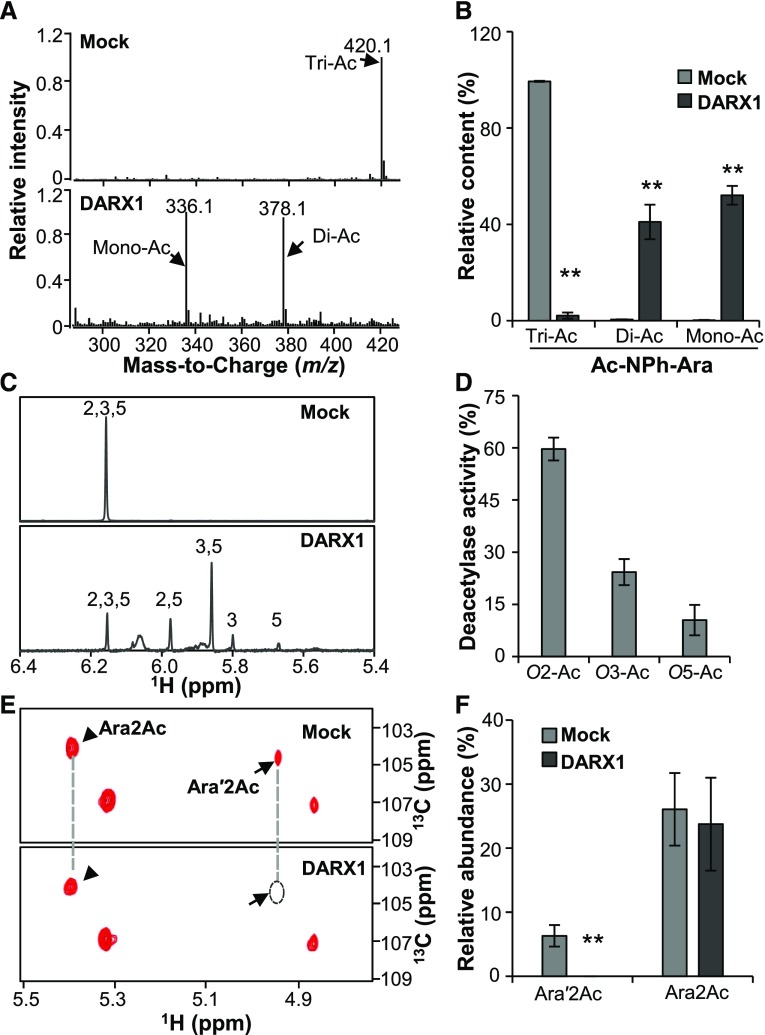
Figure 3.
DARX1 Catalyzes the Deacetylation of Acetylated Arabinoside and Arabinoxylo–Oligosaccharide.
(A) Representative LC-Quadrupole Time-of-Flight Mass Spectrometer spectra of Ac-NPh-Ara after incubation with recombinant DARX1 proteins.
(B) Quantification of Di-Ac-NPh-Ara and Ac-NPh-Ara generated in the reactions shown in (A). Error bars = mean ± sd (n = 3 replicates of assays with independent proteins). **P < 0.01 by Welch’s unpaired t test.
(C) Anomeric region of proton NMR spectra of the Ac-NPh-Ara products generated by partial digestion with DARX1. Numbers on the signal peaks indicate the retained acetyl groups.
(D) Quantification of the acetyl groups released from the reactions in (C). O2-Ac, O3-Ac, and O5-Ac indicate the acetyl groups released from O-2, O-3, and O-5 postions of acetylated arabinoside, respectively. Error bars = mean ± sd (n = 3 replicates of assays with independent proteins). **P < 0.01 by Welch’s unpaired t test.
(E) Representative HSQC spectra of xylooligosaccharides after DARX1 treatment. Arrowheads and arrows indicate the signals of Ara2Ac and Ara′2Ac, respectively.
(F) Quantification of the acetyl groups released from the reactions shown in (E). The data are expressed as signal abundance relative to the total integral signals of Ara. “Mock” in this figure represents the negative controls in the absence of DARX1. Error bars = mean ± sd (n = 3 replicates of assays with independent proteins). **P < 0.01 by Welch’s unpaired t test.

