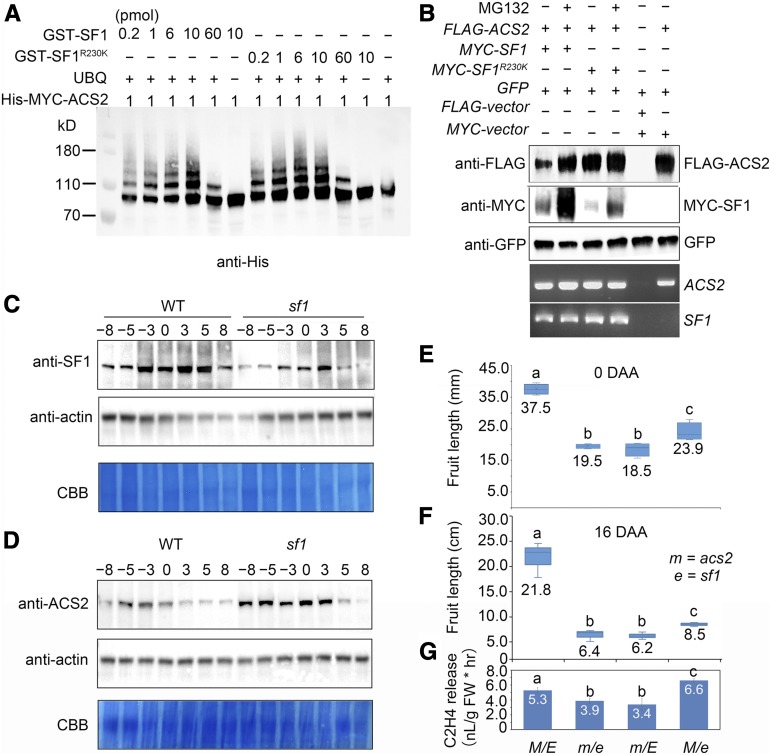
Figure 5.
ACS2 is a Substrate of SF1.
(A) Ubiquitination of ACS2 by SF1 in vitro. The above two lines of numbers represent the concentration of GST-SF1 and GST-SF1R230K. Reaction were analyzed by immunoblotting using anti-His.
(B) SF1 promotes ACS2 degradation via 26S proteasomes. When ACS2 and SF1R230K were coexpressed, the dramatic degradation of SF1R230K proteins resulted in a significant accumulation of ACS2. SF1 and ACS2 were expressed in N. benthamiana leaves treated with (+) or without (−) MG132. GFP was used as the control for the infiltration event. Bottom panels, RNA levels of ACS2 and SF1.
(C) and (D) Expression profiles of SF1 (C) and ACS2 proteins (D) in wild-type (WT) and sf1 fruit during early fruit development, showing decreased SF1 protein levels while increased ACS2 protein levels in sf1. Actin was used as an internal control. Coomassie brilliant blue (CBB) staining of the bottom part of each blot is shown as a loading control.
(E) and (F) Boxplots show the epistasis of acs2 (m) to sf1 (e) genetically. Twenty fruits of each genotype at 0 DAA and 16 DAA are shown: wild type (M E), m e, m E, and M e fruit from 20 independent plants were identified to measure fruit length. Bars = means ± sem (n = 20). Different lowercase letters indicate significant difference, P < 0.05, Tukey’s test.
(G) The ethylene release in wild type (M E), m e, m E, and M e fruits at 0 DAA, showing that m E and m e fruits produced relatively less ethylene, and M e fruits produced more ethylene than in wild type. FW: Fresh Weight. Bars = means from three independent fruits ± sem. Different lowercase letter indicates significant difference, P < 0.01, Tukey’s test.

