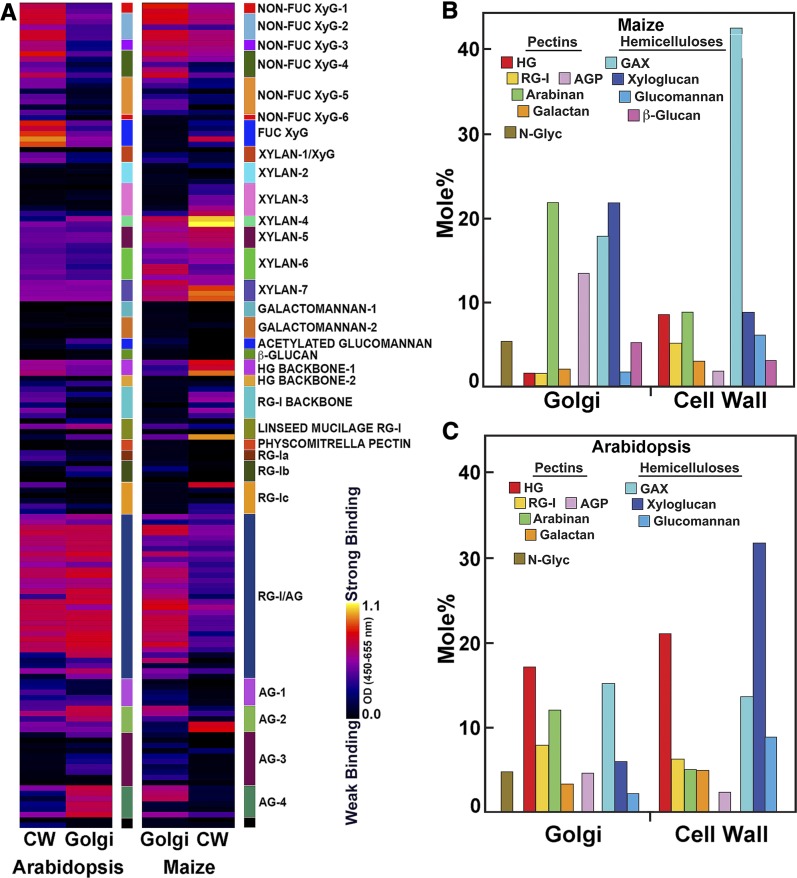
Figure 4.
Comparative Glycome and Polysaccharide Profiles of Cell Wall and Golgi From Maize Etiolated Coleoptiles and Arabidopsis Seedlings.
(A) Glycome profiles of fractions obtained by sequential extractions of isolated maize and Arabidopsis cell walls compared with those from Golgi membranes screened against a collection of plant glycan-directed mAbs. The cell-wall intensities are a composite of relative epitope contributions in chelator- and alkali-soluble fractions (Figure 2). The Golgi relative intensities were normalized to adjust for differences in loading. Relative intensities of binding of mAbs are represented as heatmaps as described in Figure 2.
In (B) maize and (C) Arabidopsis, the relative proportions of Golgi and pectin and hemicellulosic polysaccharides sequentially extracted in chelator- and alkali-soluble cell-wall fractions. Estimations of polysaccharide abundance were calculated as described in Figure 3. Golgi membranes uniquely contained 2-, 6-, and 3,6-Man residues associated with N-linked glycoproteins (N-Glyc). Protocols for polysaccharide assignment are described in Supplemental Table 1. Abundances of diagnostic linkages for established polysaccharide structures are in Supplemental Tables 2 and 3. Estimations of the mole % of each polysaccharide in total noncellulosic cell wall were scaled to their respective mass contributions to the four chelator- and alkali-soluble fractions described in Figure 3.

