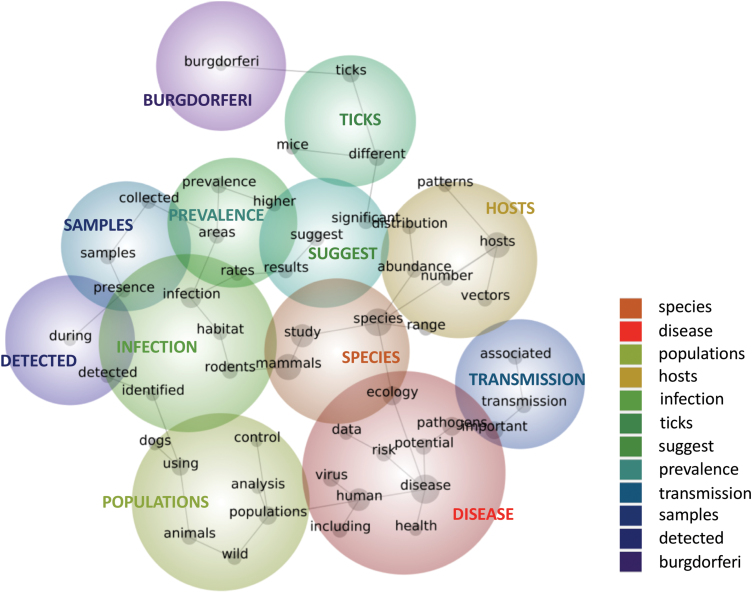
Fig. 1.
A concept map depicting the major research themes represented in the academic literature on disease ecology of mammals (including both reviews and journal articles). Words in black text are the concepts comprising larger themes. The size of the gray dot underlying each concept reflects its connectivity to other concepts on the map (i.e., how often that concept co-occurs with every other concept on the map); concepts with larger gray dots have greater connectivity to other concepts. The spanning tree (gray lines) draws further attention to the strongest connections between particular concepts. The larger, colored circles depict prominent themes, which are made up of highly connected concepts that appear together frequently within the same text segments. Concepts that “travel together” in this way also tend to appear near each other in map space. Occasional overlaps are meaningless. The name of each theme is determined by the most highly connected concept within the theme. These theme names are displayed within each circle as well as in the inset legend, which is organized in descending order of connectivity.

