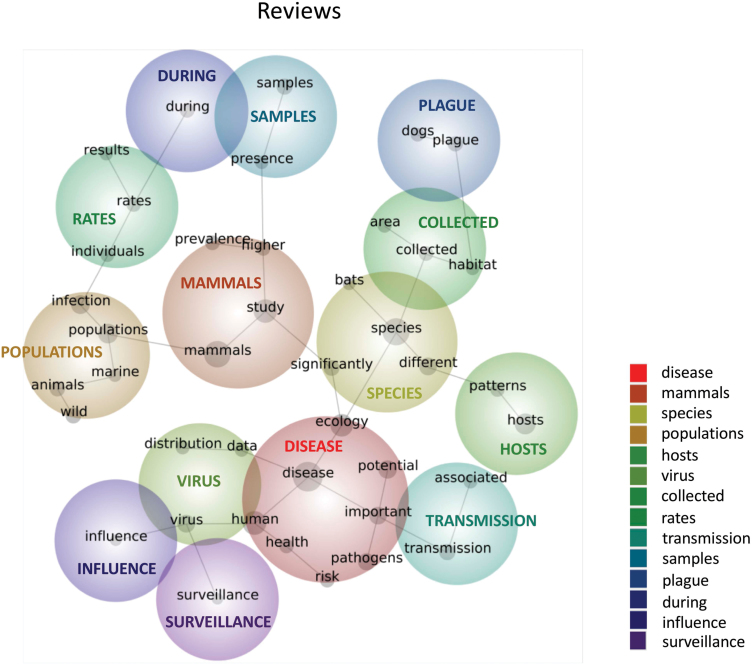
Fig. 2.
A concept map depicting the major research themes represented in academic review articles on disease ecology of mammals (excluding non-review journal articles). Each word represents a concept, with the size of gray dots beneath each concept scaling with the degree to which each concept is connected to other concepts. The spanning tree (gray lines) depicts the strongest connections between particular concepts across the corpus. Themes are collections of concepts that are identified by colored circles, with warmer colors corresponding to the most prominent concept within the theme. Theme labels within circles match colors in the legend, which is organized in descending order of connectivity.

