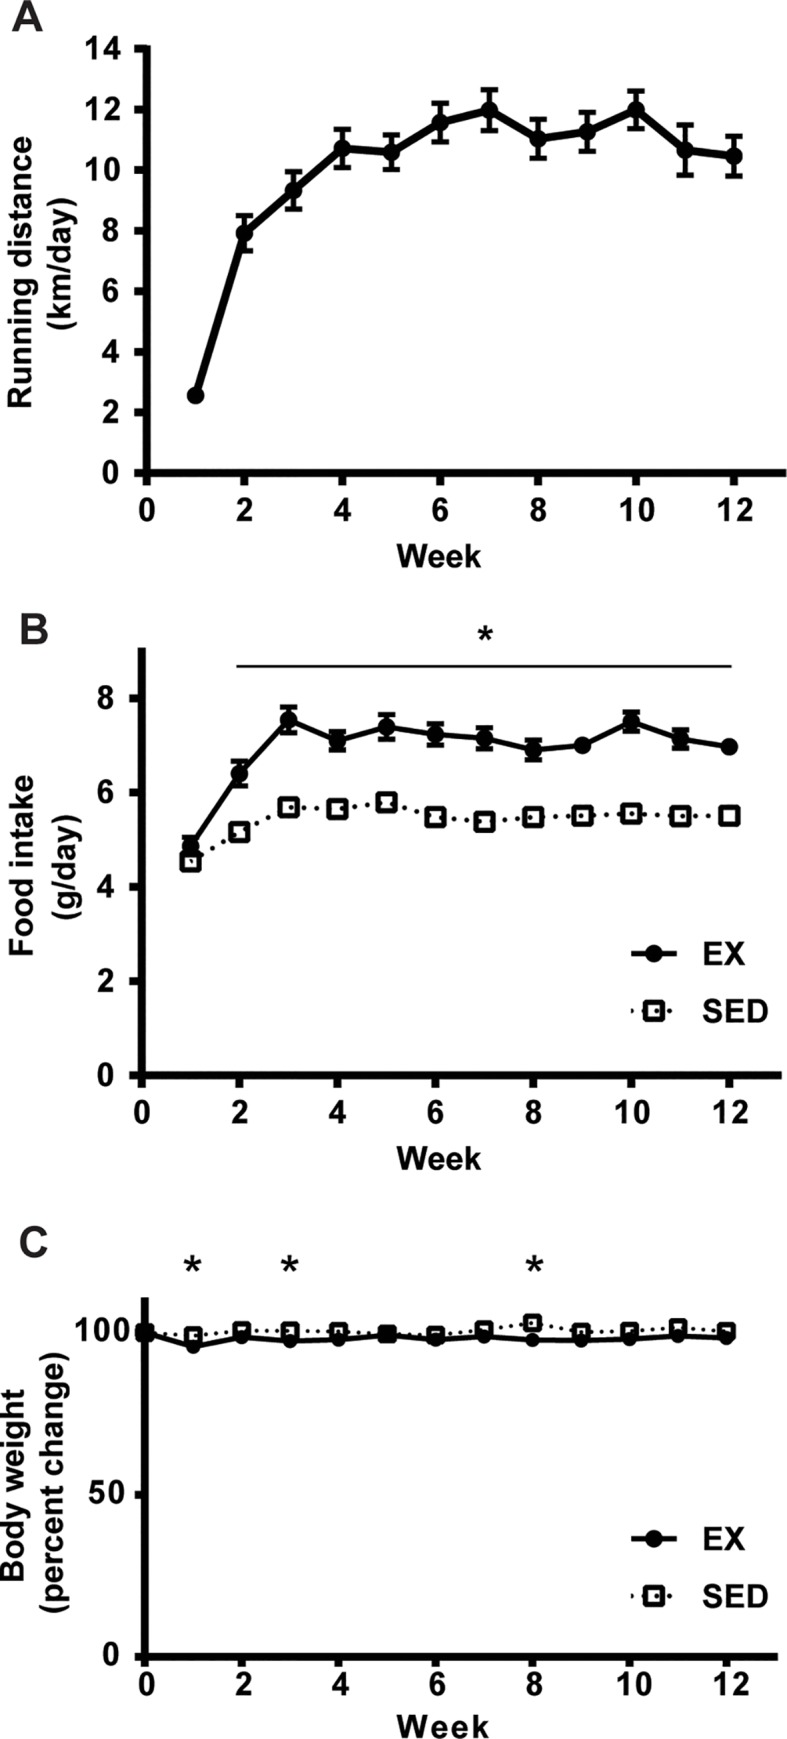
Fig 1. Daily running distance and changes in food intake and body weight in EX and SED mice during 12 weeks of voluntary wheel intervention.

Graphs show A. the average daily running distance (km/day), B. food intake (g/day); *p<0.001 compared to SED mice, and C. changes in body weight expressed as percentage of that at the beginning of the 12-week voluntary wheel intervention; *<0.05 compared to SED mice (n = 19 per group). The data represent the mean ± SEM.
