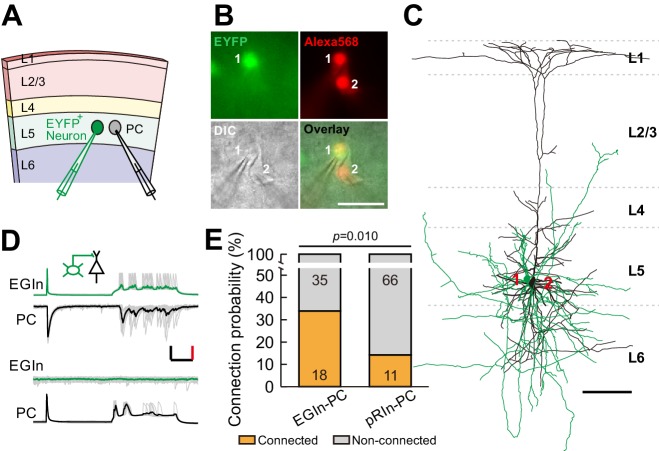
Figure 4. EGIns exhibit higher synaptic connectivity than pRIns at P5–7.
(A) Schematic diagram represents dual patch-clamp recording of an EYFP+ neuron and a neighboring PC in layer 5. (B) Representative fluorescent (EYFP, EGIn; Alexa 568, recorded neurons), IR-DIC and merged images of dual patch-clamp recording from an EYFP+ neuron and a neighboring PC. Cell one is an EYFP+ EGIn and cell two is a neighboring PC. Scale bar, 50 μm. (C) Reconstructed morphology of the two neurons patched in (B). Reconstructed EGIn is shown in green and PC is shown in black. Scale bar, 100 μm. (D) Representative traces showing an EGIn exert unidirectional chemical synapse onto a neighboring PC. The green (EGIn) and black (PC) lines indicate the average traces. Inset indicates unidirectional synaptic input from an EGIn to a PC. Scale bars: 50 pA (vertical, black), 50 mV (vertical, red), and 100 ms (horizontal, black). (E) Proportion of synaptic connections between EGIns and pyramidal cells and between pRIns and pyramidal cells.

