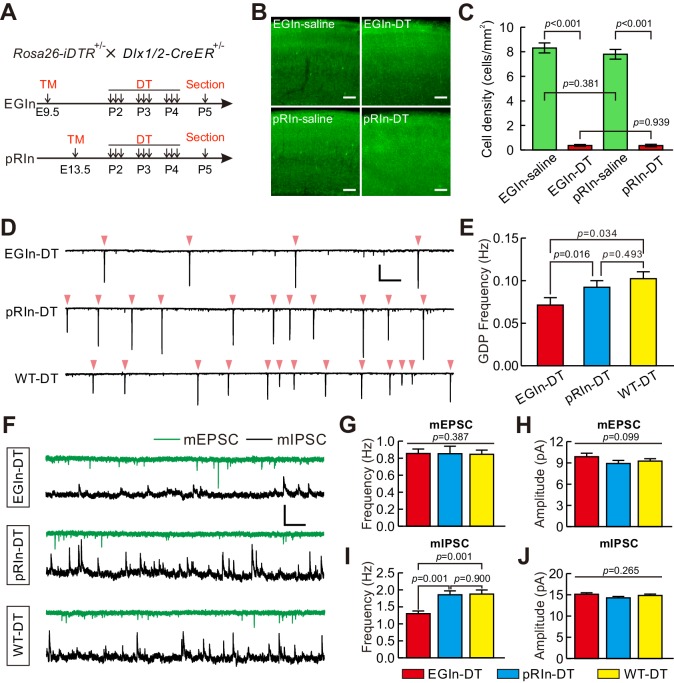
Figure 6. Ablation of EGIns reduced neocortical spontaneous network synchronization and the frequency of mIPSCs at early postnatal stages.
(A) Schematic diagram representing ablation of EGIns and pRIns after P2. (B) Sample images showing DT administration can significantly reduce cell density of EGIns and pRIns at P5. Scale bar, 100 μm. (C) Quantitative analysis of DT ablation efficiency. (D) Sample traces showing GDPs recorded from EGIn DT-injected mice (top), pRIn DT-injected mice (middle) and wild-type DT-injected mice (bottom). Pink arrowheads indicate onsets of synchronized activities. Scale bars: 200 pA (vertical), 10 s (horizontal). (E) Quantitation of GDP frequencies in EGIn DT-injected mice, pRIn DT-injected mice and wild-type DT-injected mice. (F) Representative traces of inward mEPSCs (green traces) and outward mIPSCs (black traces) recorded in layer five pyramidal neurons in EGIn DT-injected mice, pRIn DT-injected mice and wild-type DT-injected mice. Scale bars: 20 pA (vertical), 1 s (horizontal). (G–J) Histograms of the frequencies (G) and amplitudes (H) of mEPSCs, and the frequencies (I) and amplitudes (J) of mIPSCs in EGIn DT-injected mice, pRIn DT-injected mice and wild-type DT-injected mice. Detailed statistical analysis, detailed data, and exact sample numbers are presented in the Figure 6—source data 1. Error bars indicate mean ± SEM.


