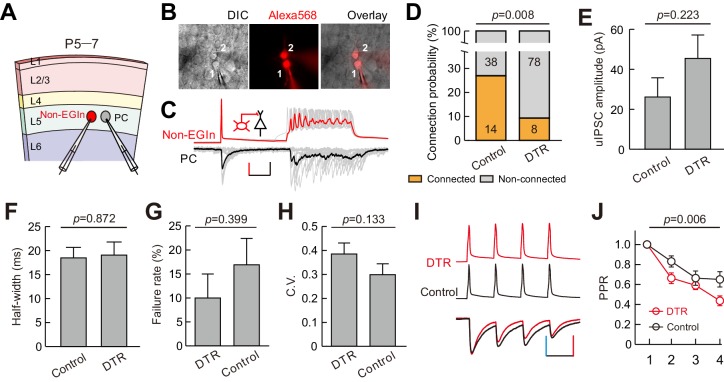
Figure 7. EGIns ablation altered synaptic formation and presynaptic transmitter release from non-EGIns to PCs at early postnatal stage.
(A) Schematic diagram represents dual patch-clamp recording of an EYFP- non-EGIn and a neighboring PC in layer 5. (B) Representative fluorescent (Alexa 568, recorded neurons), IR-DIC and merged images of dual patch-clamp recording from a non-EGIn and a neighboring PC. Cell one is a non-EGIn and cell two is a neighboring PC. (C) Representative traces showing a non-EGIn exert unidirectional chemical synapse onto a neighboring PC. The red (non-EGIn) and black (PC) lines indicate the average traces. Inset indicates unidirectional synaptic input from a non-EGIn to a PC. Scale bars: 30 pA (vertical, black), 30 mV (vertical, red), and 100 ms (horizontal, black). (D) Proportion of non-EGIns→PCs synaptic connections between EGIn-EYFP mice (control) and EGIn-ablated mice (DTR). (E–F) Quantification of the peak amplitude (E) and half-width (F) of non-EGIns→PCs uIPSCs between EGIn-EYFP mice (control) and EGIn-ablated mice (DTR). (G–H) Quantification of failure rate (G) and the coefficient of variation (C.V.) (H) of non-EGIns→PCs synaptic transmission. (I) Amplitude-scaled overlay of paired-pulse ratio (PPR) responses in non-EGIns→PCs connections between EGIn-EYFP mice (control) and EGIn-ablated mice (DTR). Red, DTR; black, control. Scale bars: 60 pA (vertical blue), 60 mV (vertical, red), and 50 ms (horizontal). Four presynaptic action potentials were evoked at 20 Hz. (J) The normalized peak amplitude of non-EGIns→PCs uIPSCs showed short-term depression, and significant difference in PPR was found between EGIn-EYFP mice (control) and EGIn-ablated mice (DTR). Detailed statistical analysis, detailed data, and exact sample numbers are presented in the Figure 7—source data 1. Error bars indicate mean ± SEM. Figure Supplement and Source data.

