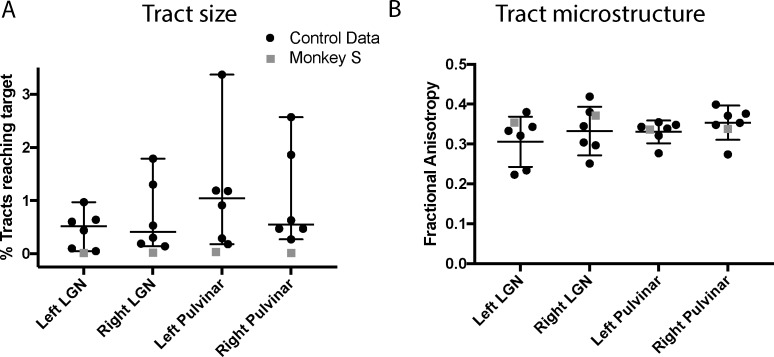
Figure 10. Quantification of tractography results.
(A) Quantification of the percentage of streamlines from the seeds in subcortical areas LGN and pulvinar reaching cortical area V5/MT in the two hemispheres. While there was considerable variability between control monkeys (black circles), the number of tracts in monkey S (grey square) is consistently lower for all tracts. (B) By contrast, the functional anisotropy values for the tracts in monkey S were comparable to the control values for both pathways. This suggests that the white matter microstructure within the tracts between V5/MT and each target structure was intact. Data points show results from individual hemispheres, the horizontal lines give the median and the 95% confidence interval for the control group.

