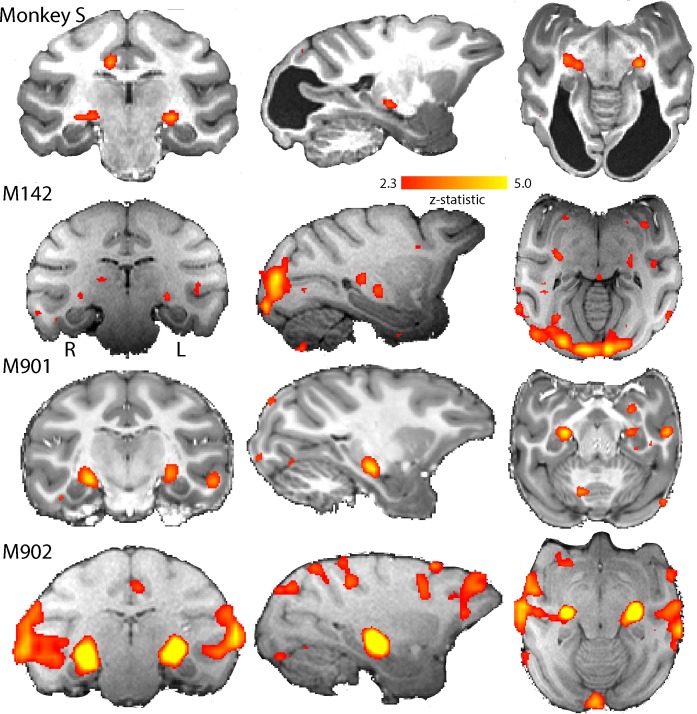
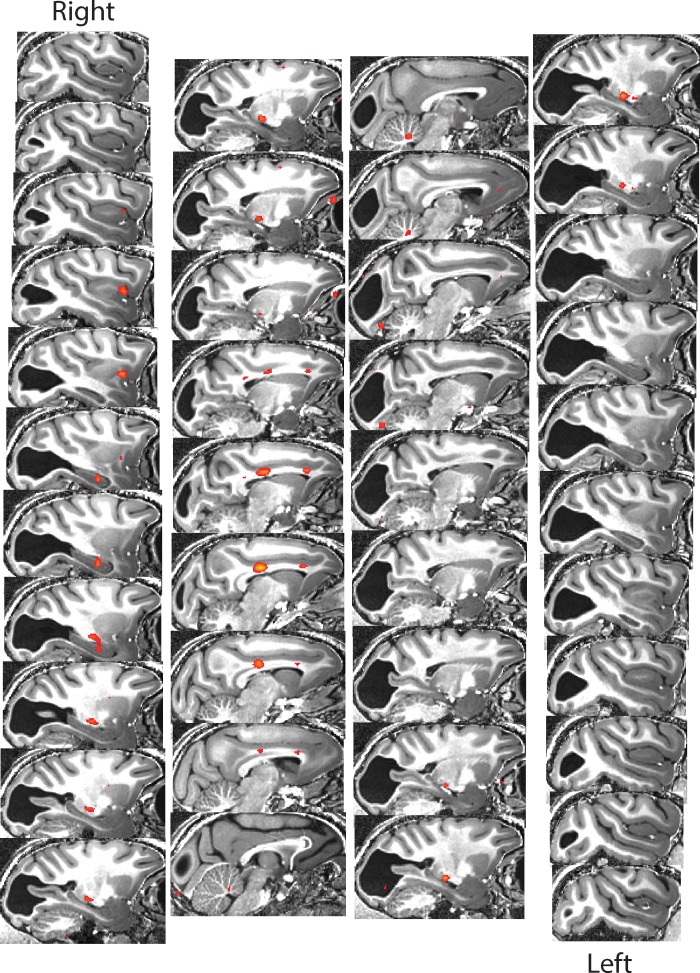
In anaesthetised monkeys, visual activation can vary for a number of reasons, including accommodation, drifting eye movements and level of anaesthesia (
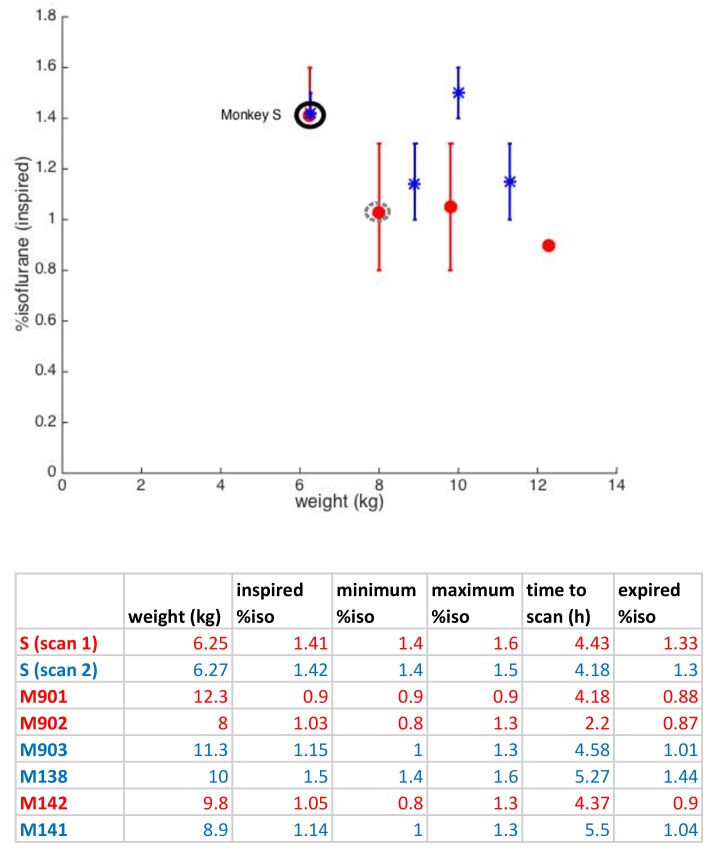
Hutchison et al., 2014). Average %isoflurane inspired during the acquisition of visual sequences in our study is plotted against the weight of the monkey at the time of the functional MRI scan. Data in red are from fMRI sessions with significant BOLD activation of the LGN due to visual stimulation (z > 2.3), in blue from sessions without a significant response. The two scanning sessions for monkey S are indicated with a black ring, the only female Rhesus macaque in the control sample with a grey dashed circle. Vertical bars depict the range of %isoflurane levels throughout the visual functional scan. The table underneath summarizes weight, mean %isoflurane level inspired, minimum and maximum values, time from onset of sedation, and mean %isoflurane expired.


