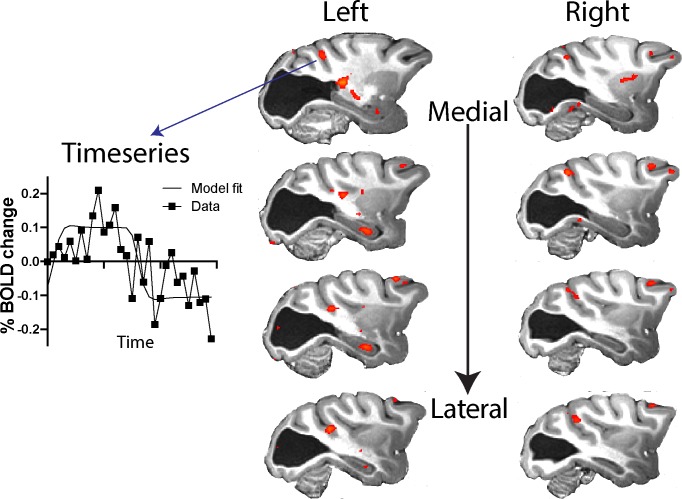
Figure 7. Response to visual motion in dorsal STS.
Illustration of BOLD activation (z > 2.3) in series of slices through V5/MT in both hemispheres of monkey S. While there was no extended area of activation to the moving dot stimulus, there were a number of small regions of activation across dorsal regions of the STS. The timeseries plot shows the average signal extracted from one of these regions of activation (z > 2.3) shown in the top left panel.

