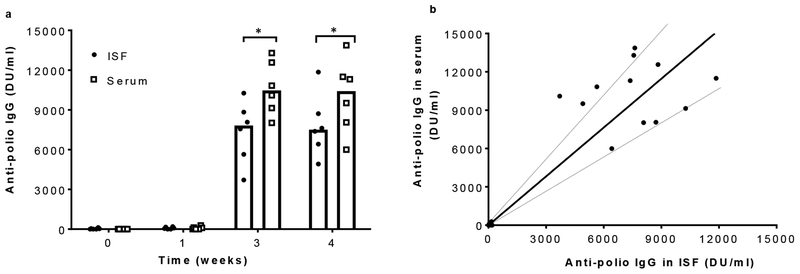
Fig. 3.
Anti-polio IgG responses to inactivated polio vaccination in rats. a) Anti-polio IgG titers determined by ELISA in ISF and serum samples collected before and 1, 3 and 4 weeks after vaccination with trivalent IPV by intramuscular injection. Each data point represents a single animal while the bars represents the median values of each group (n = 6 rats). Asterisk (*) represents a significant difference (Student’s t-test, p < 0.03). b) Correlation between anti-polio IgG titers in paired serum and ISF samples (r = 0.90, p<0.005, Pearson’s correlation coefficient test). Dotted lines represent ± 30% of the slope of the linear regression line (shown as solid black line), which are included as a visual guide. Data are the same as shown in (a)

