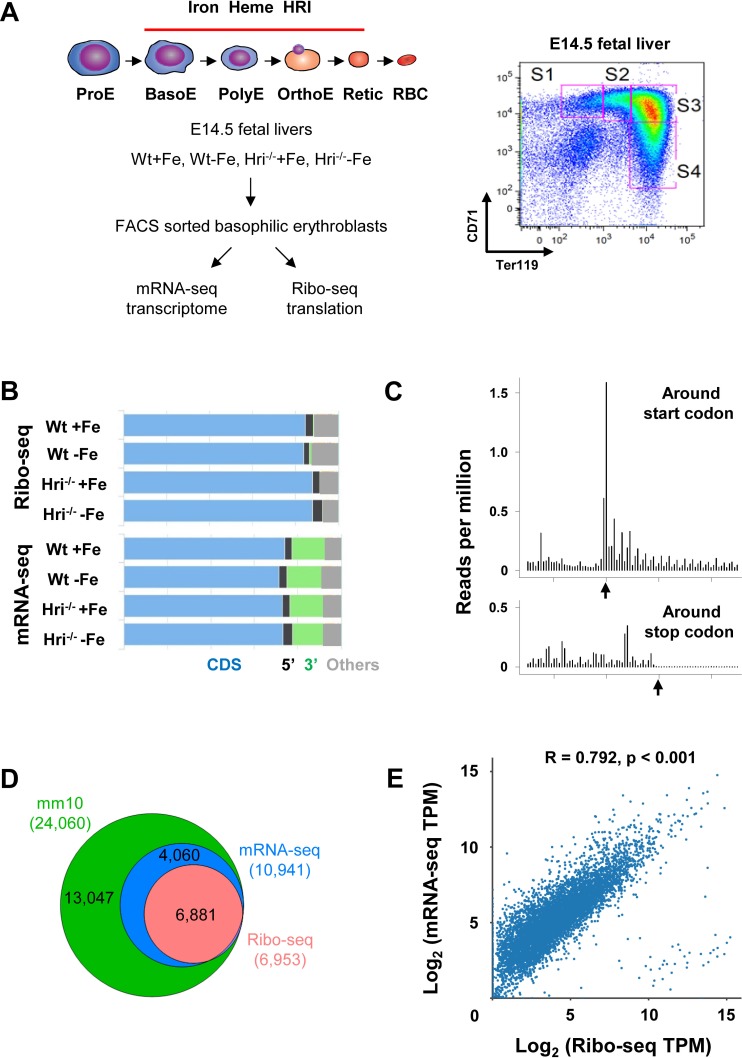
Figure 1. Overview of Ribo-seq and mRNA-seq data.
(A) Illustration of experimental designs. Basophilic erythroblasts (EBs) (S3) from E14.5 FLs of Wt +Fe, Wt –Fe, Hri–/– +Fe and Hri–/– –Fe embryos were sorted and subjected to Ribo-seq and mRNA-seq library preparations. (B) Distribution of the mapped reads from Ribo-seq and mRNA-seq from one replica. (C) A representative plot of the triplet periodicity of Ribo-seq from Wt –Fe EBs. Arrows indicate the start and stop codons. (D) Gene coverages of Ribo-seq and mRNA-seq data in the mouse genome (UCSC, mm10). (E) Scatter plot and correlation analysis of log2-transformed TPM (transcript per million) of Ribo-seq and mRNA-seq data from Wt +Fe EBs. E, Erythroblast; RBC, red blood cell; Retic, Reticulocyte.

