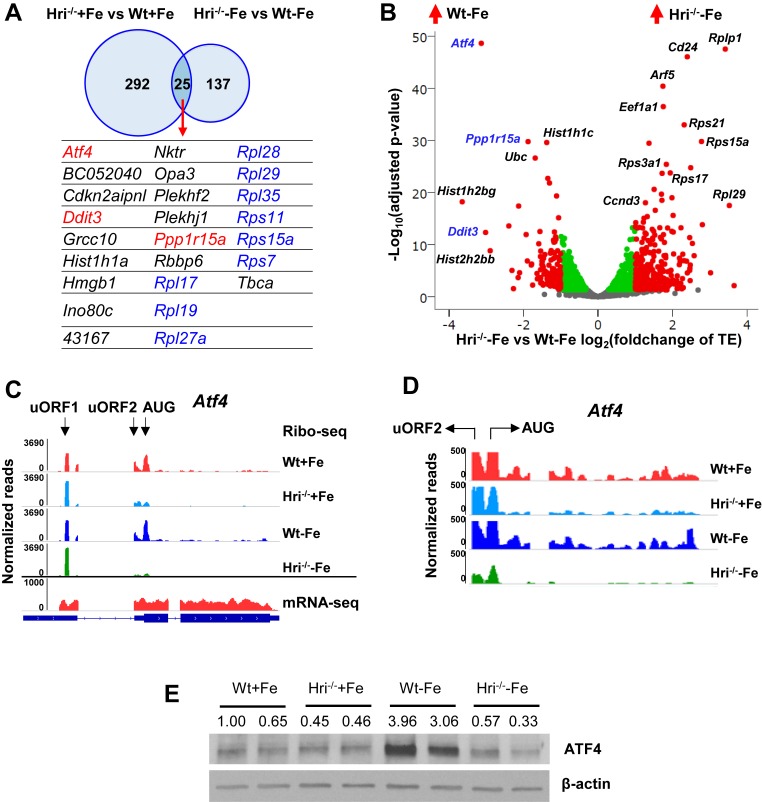
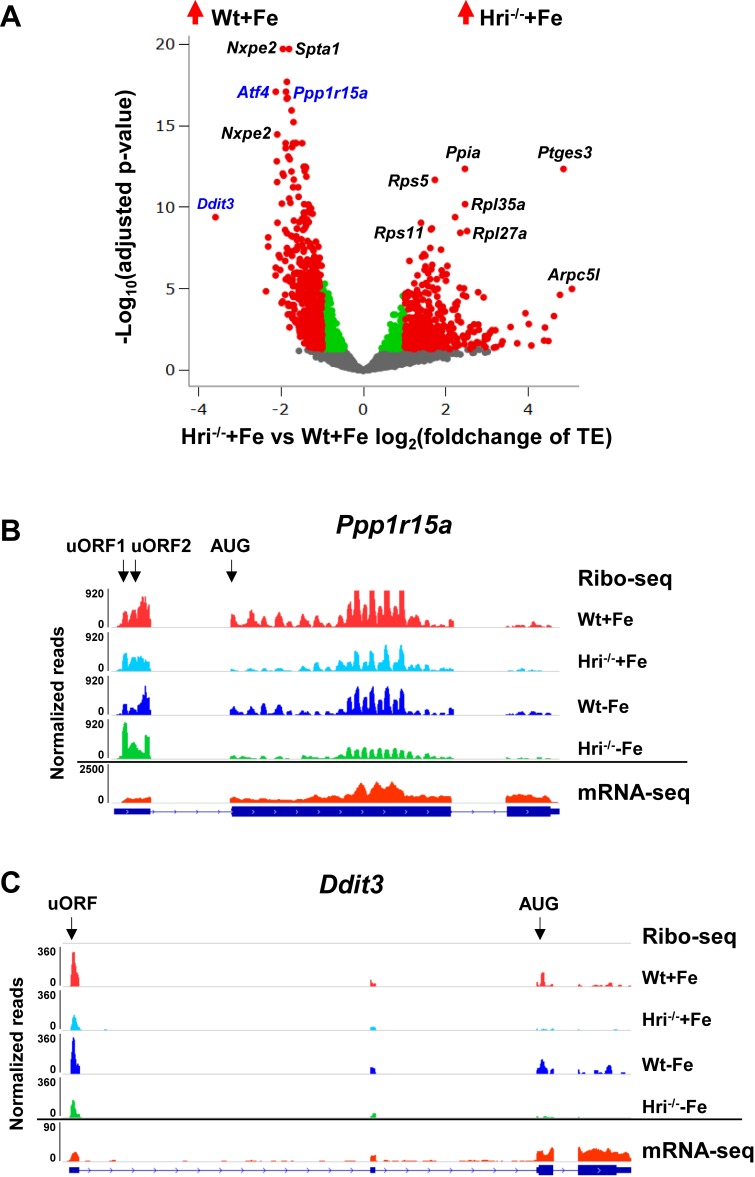
Figure 2. Differentially translated mRNAs in Hri–/– EBs and iron deficiency.
(A) The mRNAs that are significantly differentially translated between Hri–/– and Wt EBs in +Fe or –Fe conditions. (B) Volcano plot of mRNAs that are differentially translated between Hri–/– –Fe and Wt –Fe EBs. Red dots on the positive end of the X-axis indicate significantly differentially translated mRNAs that were upregulated in Hri–/– –Fe EBs, whereas red dots on the negative end of the X-axis indicate significantly differentially translated mRNAs that were upregulated in Wt –Fe EBs. Green and gray dots indicate mRNAs that have no significant difference in translation. TE, translational efficiency. (C) Ribosome occupancies, as visualized using Integrative Genomics Viewer (IGV), of Atf4 mRNA, with an enlarged view shown in (D). (E) ATF4 protein expression in E14.5 FL cells. Ratios of ATF4/β-actin expression are indicated.


