. 2019 Apr 29;8:e46976. doi: 10.7554/eLife.46976

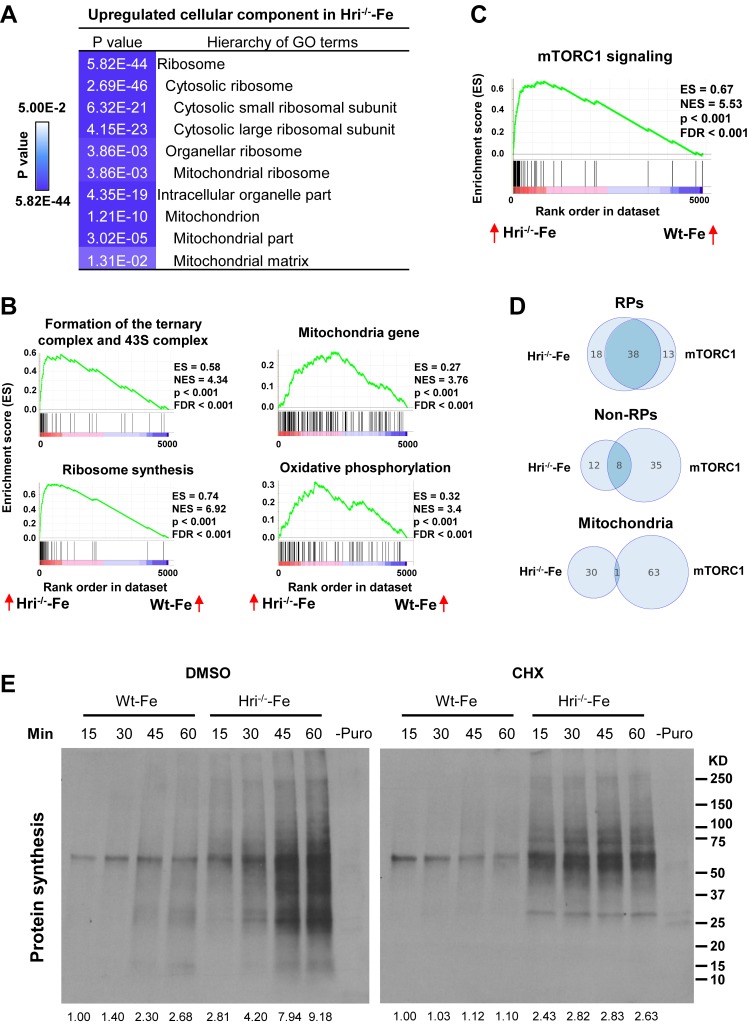
Figure 3. Analyses of the mRNAs that are differentially translated between Wt and Hri–/– EBs.

(A) GO analysis of the most highly translated mRNAs in Hri-/– –Fe EBs compared to Wt –Fe EBs. (B) Increased 43S initiation complex, ribosomal protein (RP) synthesis and mitochondrial pathways in Hri–/– –Fe EBs compared to Wt –Fe EBs by Gene Set Enrichment Analysis. (C) Increased mTORC1 signaling pathway in Hri–/– –Fe EBs compared to Wt –Fe EBs. (D) Venn diagrams comparing mRNAs that are differentially translated in Hri–/– –Fe EBs and Wt –Fe EBs, and that are known mTORC1 targets in the categories of RPs, non-RPs and mitochondrial proteins. (E) Protein synthesis (total (left) and in mitochondria (right)) of erythroid cells from the bone marrow (BM) of Wt –Fe and Hri–/– –Fe mice. Cells were treated with dimethyl sulfoxide (DMSO) or cycloheximide (CHX) for 15 min before the addition of puromycin for 15–60 min as indicated. Protein synthesis was determined by the nascent polypeptides covalently linked by puromycin using anti-puromycin antibody. Equal numbers of nucleated cells were loaded to each lane. The numbers of cells loaded for cytoplasmic protein synthesis were 30% of those loaded for mitochondrial protein synthesis. The results shown are from the same exposure time for developing the Western blot. Puromycin signals from polypeptides of the entire lane were quantified for protein synthesis activity and the protein synthesis in the first lane was define as 1. –Puro indicates cells without puromycin treatment, which were used as a negative control for Western signals from anti-puromycin antibody. FDR, false discovery rate; NES, normalized enrichment score.

Figure 3.

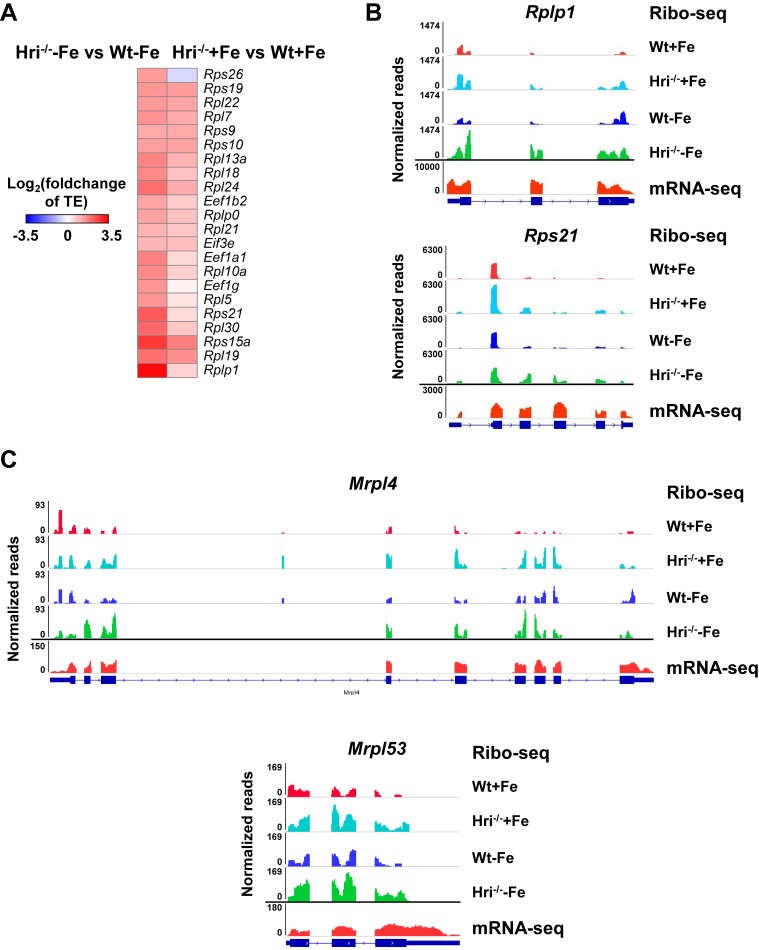
Figure 3—figure supplement 1. Differential translation of cytoplasmic and mitochondrial RP mRNAs between Wt and Hri–/– EBs.

Figure 3—figure supplement 1.

(A) The heatmaps of significantly differentially translated 5’ TOP/TOP-like mRNAs, the mTORC1 translational targets. Positive values of Log2(foldchange of TE) indicate upregulated translation in Hri–/– –Fe EBs as compared to Wt –Fe EBs or in Hri–/– +Fe EBs as compared to Wt +Fe EBs. (B) IGV-illustration of ribosome occupancies of two representative cytoplasmic RP mRNAs, Rplp1 and Rps21, and (C) of the mitochondrial RP mRNAs, Mrpl4 and Mrpl53.
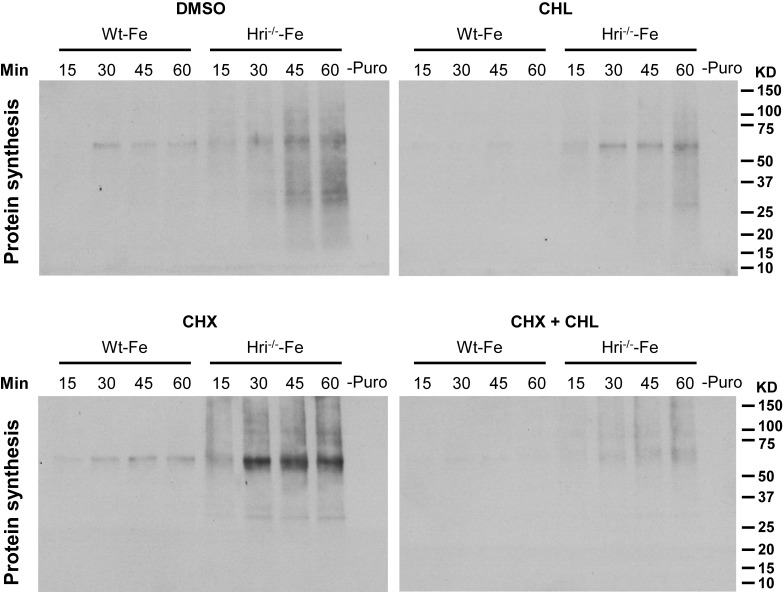
Figure 3—figure supplement 2. Inhibition of mitochondrial protein synthesis by chloramphenicol.

Figure 3—figure supplement 2.

Protein Synthesis assays were performed in DMSO-treated, CHL-treated, CHX-treated and CHX + CHL-treated erythroid cells from the BM of Wt –Fe and Hri–/– –Fe mice. The DMSO-treated control is used to measure total protein synthesis in the cells, cytoplasm and mitochondria. In the presence of CHX, a cytoplasmic protein synthesis inhibitor, only mitochondrial protein synthesis was measured. In the presence of chloramphenicol (CHL), a mitochondrial protein synthesis inhibitor, only cytoplasmic protein synthesis was measured. In the presence of both CHX and CHL, protein synthesis in both the cytoplasm and mitochondria was inhibited. Cells were treated with DMSO and the inhibitors for 15 min before addition of puromycin for 15–60 min as indicated. Protein synthesis was determined by the nascent polypeptides covalently linked by puromycin using anti-puromycin antibody. Equal numbers of nucleated cells were loaded to each lane. The numbers of cells loaded for cytoplasmic protein synthesis were 30% of those loaded for mitochondrial protein synthesis. The results shown are from the same exposure time for developing the Western blots. –Puro indicates cells without puromycin treatment, which were used as a negative control for Western signals from the anti-puromycin antibody.
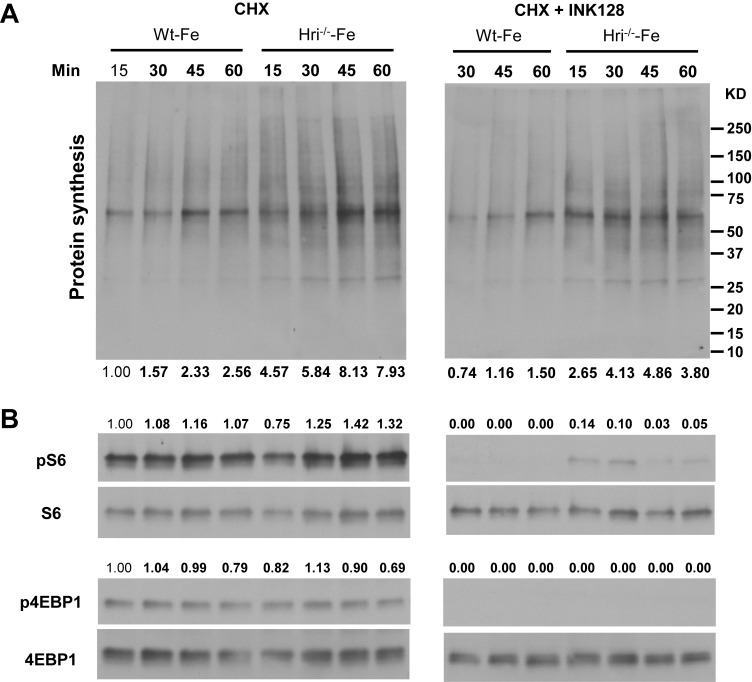
Figure 3—figure supplement 3. Inhibition of mitochondrial protein synthesis by INK128.

Figure 3—figure supplement 3.

(A) Protein synthesis in the CHX-treated and CHX + INK128-treated erythroid cells from the BM of Wt –Fe and Hri–/– –Fe mice. In the presence of CHX, only mitochondrial protein synthesis was measured. In the presence of both CHX and INK128, a mTORC1 inhibitor, mTORC1-regulated mitochondrial protein synthesis was inhibited. Cells were treated with inhibitors for 15 min before the addition of puromycin for 15–60 min as indicated. Measurement of protein synthesis was as described in Figure 3—figure supplement 2. (B) Inhibition of mTORC1 activities as measured by pS6 and p4EBP1 levels. Signal from Wt –Fe with CHX treatment and 15 min treatment of puromycin was defined as 1. Equal numbers of nucleated cells were loaded into each lane. The results shown are from the same exposure time for developing the Western blot.