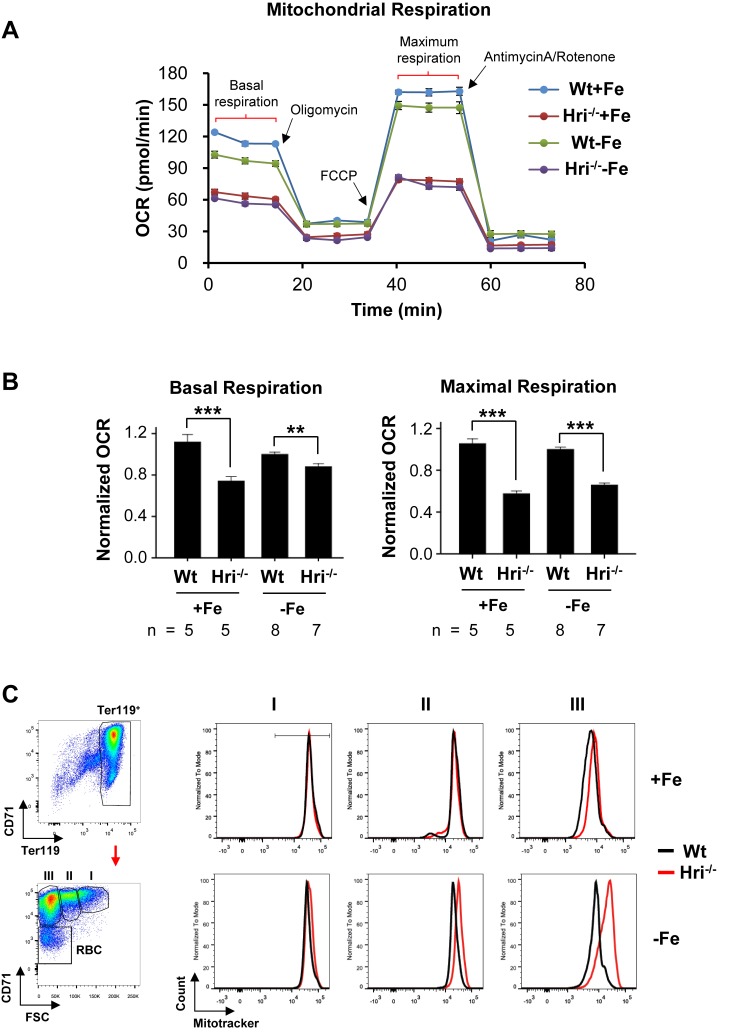
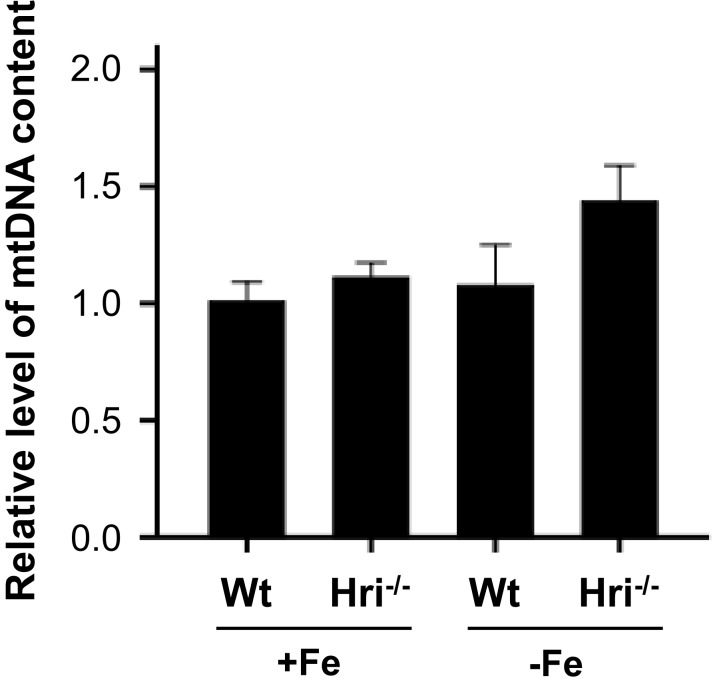
Figure 4. Decreased mitochondrial respiration in HRI deficiency.
(A) A representative result for the oxygen consumption rate (OCR) of Wt and Hri–/– erythroid cells. Erythroid cells were isolated from the BM of Wt and Hri-–/– mice in +Fe and –Fe conditions. Five technical replicas were performed for each condition. (B) Quantitative analysis of basal and maximal OCR from four separate experiments. The numbers of mice used in each condition are indicated. OCR of Wt –Fe erythroid cells was defined as 1. Data were presented as mean ± SE. **p<0.01, ***p<0.001. (C) Representative plots of mitochondrial mass of erythroid cells at different differentiation stages obtained from mitotracker flow cytometry analysis. A diagram of gating for the differentiation stages is shown on the left.


