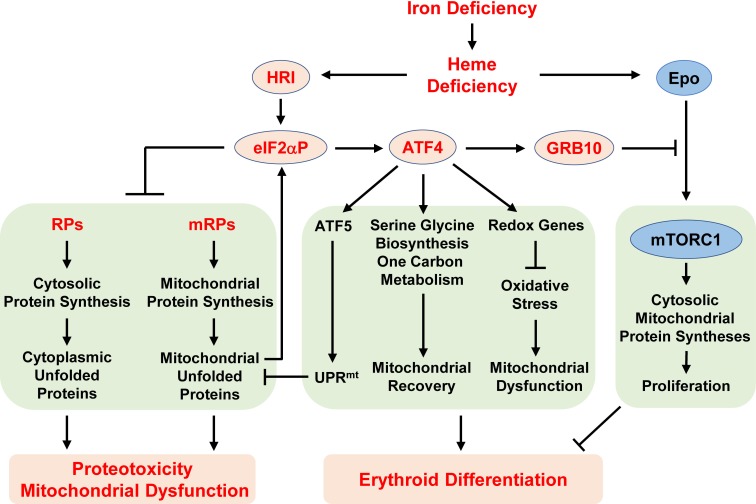
Figure 8. Proposed model of the regulation of erythropoiesis by heme and the HRI-ISR pathway during ID.
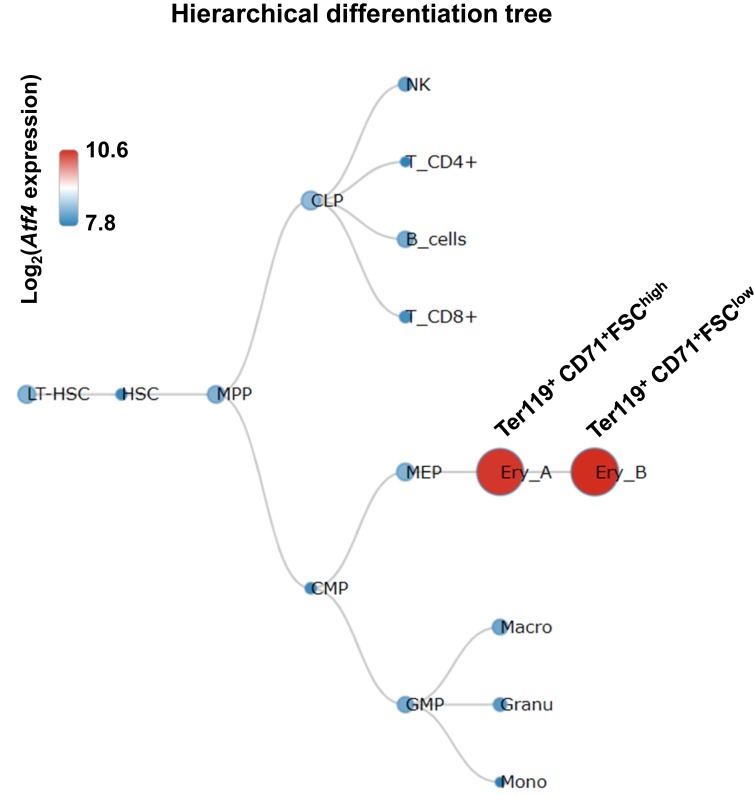
Diet-induced systemic ID results in heme deficiency, which activates HRI to phosphorylate its substrate eIF2α. The primary function of eIF2αP is to inhibit general protein synthesis in both the cytoplasm and mitochondria via decreased translation of ribosomal protein mRNAs from both cellular compartments. In the absence of HRI, continued protein synthesis results in the accumulation of unfolded proteins in both the cytoplasm and mitochondria, leading to proteotoxicity and mitochonfrial dysfunction. Second, eIF2αP also enhances the translation of Atf4 mRNA via regulation by uORFs. Atf4 mRNA is the mRNA that shows the greatest differences in translation levels between Wt and Hri–/– EBs. The ATF4 protein induces the expression of three genetic pathways to activate mitochondrial UPR (UPRmt), reprogram mitochondrial metabolism and reduce oxidative stress, all of which enables adaptation to ID and erythroid differentiation. Strikingly, the expression of ATF4 target genes is most highly activated in ID and requires HRI. Thus, assessment of the global genome-wide gene expression of primary EBs in vivo reveals that HRI-ISR contributes most significantly to adaptation to ID. We have shown previously that HRI-ISR suppressed mTORC1 signaling, which is activated by elevated Epo levels in ID (Zhang et al., 2018). Here, we provide evidence that GRB10 that is induced by ATF4 may be one of the molecules involved in the repression of mTORC1 signaling.


