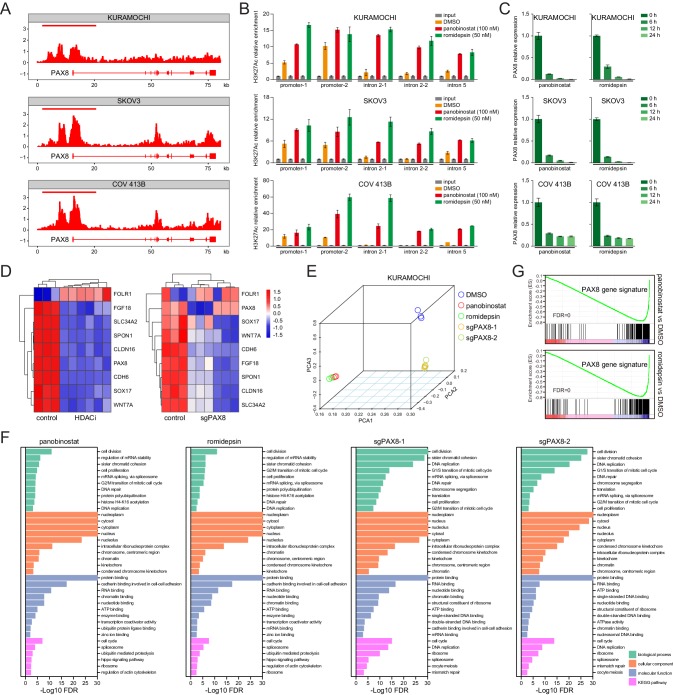
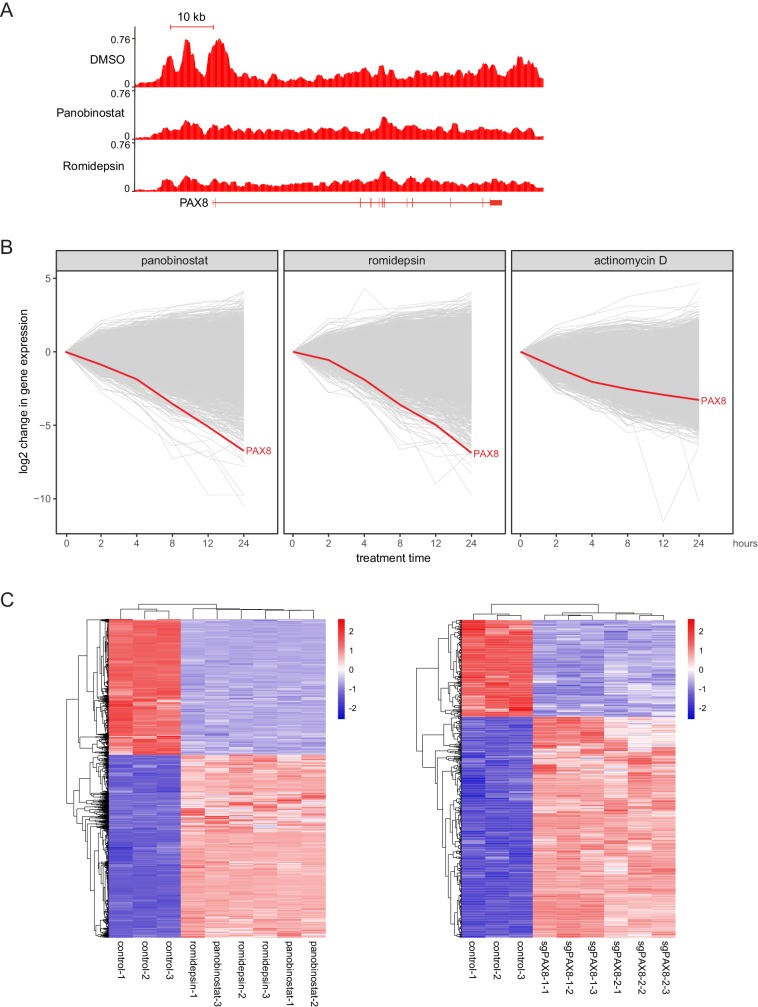
Figure 4. HDAC inhibitors epigenetically disrupt PAX8 transcription.
(A) ChIPseq profiles for H3K27ac occupancy of PAX8 gene locus in KURAMOCHI, SKOV3 and COV 413B cells. The x-axis showed gene tracks, and the y-axis showed the signal of H3K27ac binding within 50 bp bins in units of reads per million bin (rpm/bin). (B) ChIP-qPCR quantification of H3K27ac relative enrichment in PAX8 promoter or intron regions as compared to input signals. Each column represented the mean value of three biological replicates, and error bars indicated standard deviation. (C) Quantitative PCR analysis of PAX8 gene expression in KURAMOCHI, SKOV3 and COV 413B cells treated with panobinostat (100 nM) or romidepsin (50 nM). Each column represented the mean value of three biological replicates, and error bars indicated standard deviation. (D) Heatmaps of PAX8 regulon gene expression in KURAMOCHI cells as measured by RNAseq. (E) Principal component analysis (PCA) of RNAseq data in KURAMOCHI cells with HDAC treatment or PAX8 depletion. (F) Gene ontology categories and KEGG pathways overrepresented in differentially expressed transcripts that were inhibited upon HDAC treatment or PAX8 depletion in KURAMOCHI cells. (G) GSEA plots indicated downregulation of PAX8 gene signature upon HDAC treatment in KURAMOCHI cells.


