. 2019 May 13;8:e41586. doi: 10.7554/eLife.41586

Figure 2. Identification of 4 classes of MC-MLI synapses using PCA followed by k-means clustering analysis of EPSC properties during high-frequency stimulation.

(A) PCA transformation of GC-MLI STP profiles. Scatter plot of the first two principal components (PC1, PC2) obtained by analyzing EPSC properties during 100 Hz trains at numerous unitary GC-MLI synapses (n = 96). The first two components explain 69.4% of the total variance of STP. Synapses with negative PC1 values sustain glutamate release during the 10 EPSCs of the burst while PC1 with positive values synapses are depressing synapses. Positive PC2 synapses are depressing synapses while negative PC2 synapses are facilitating during EPSC #2 and EPSC #3. (B) Representative traces of the four classes of inputs (C1 to C4) determined by k-means clustering analysis during ten minimal stimulations of unitary inputs at 100 Hz. The corresponding values of averaged EPSC amplitudes plotted versus the stimulus number and normalized again the vector space model (see method) were displayed on the right panels. (C) Box plots of the charge of EPSC recorded at the first stimulus (left panel) and the paired pulse ratio (PPR) (right panel) according to the four categories of input. EPSC charges: C1 = 198.78 fC±23.46 fC, C2 = 124.96 fC±18.78 fC, C3 = 126.52 fC±22.10 fC, C4 = 74.41 fC±9.48 fC. PPR: C1 = 1.39 ± 0.07, C2 = 1.97 ± 0.19, C3 = 1.98 ± 0.19, C4 = 1.82 ± 0.14. Red bars refer to means and white bars to medians. Multiple comparisons were performed using one-way ANOVAs with Tukey post hoc tests. Only statistically significant differences between categories were shown above box plots (D) Mean values of normalized EPSC amplitudes during 100 Hz train according to the four categories of inputs. The circular diagram represents the relative proportion of each category of input from 96 unitary GC-MLI synapses.

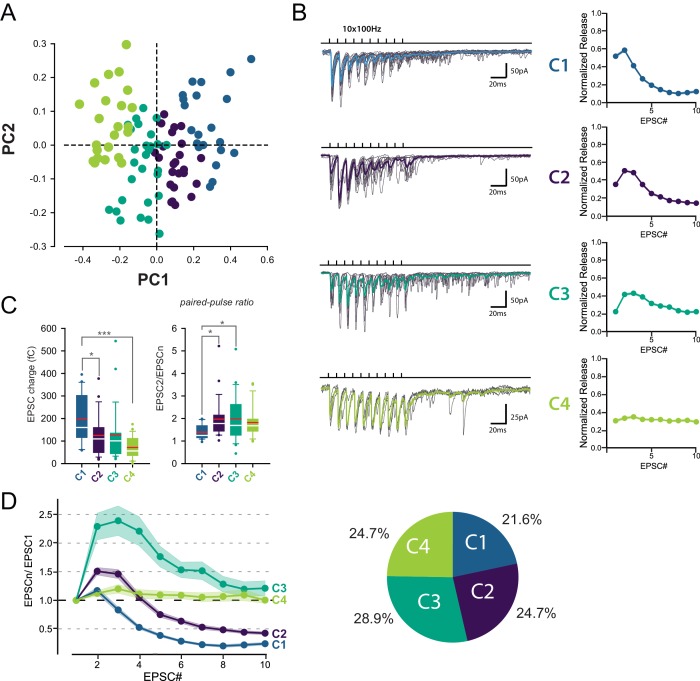
Figure 2.

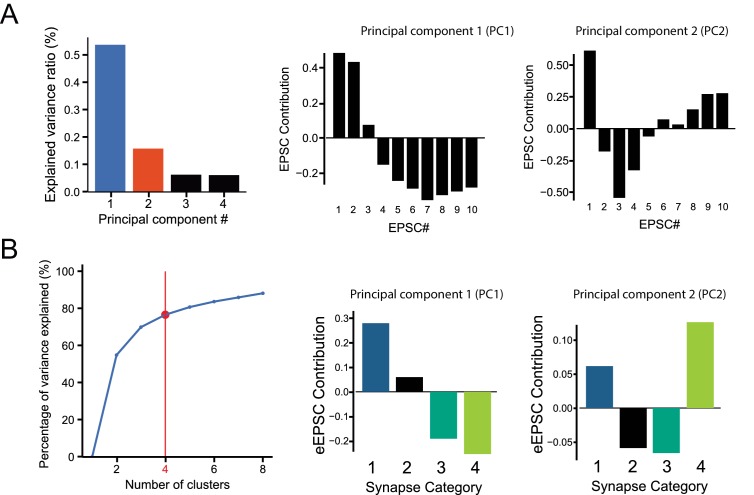
Figure 2—figure supplement 1. Details on Principal Component Analysis and k-Mean clustering parameters of minimal stimulation GC-MLI STP data.

Figure 2—figure supplement 1.

(A) Principal components 1 and 2 (PC1 and PC2) represent over 58.4% of the total variation of GC-MLI STP dataset. PC1 and PC2 explain the highest source of variability within the dataset (see Materials and methods). Thus, these two variables were used to illustrate different categories of GC-MLI STP behavior over a population of 99 synapses. A negative PC1 eigenvalue is correlated with phasic synapses while synapses displaying tonic glutamate release have a positive PC1 eigenvalue. However, PC2 is correlated to a facilitating glutamate release behavior between EPSC #2 and EPSC #4. (B) We determined the number of GC-MLI STP categories by increasing one-by-one the number of clusters obtained by k-Mean clustering method plotted against total variance for all individual observations. Using the ‘elbow method’, we chose a number of clusters ‘by eye’ above which variance of clustered observations does not increase substantially.
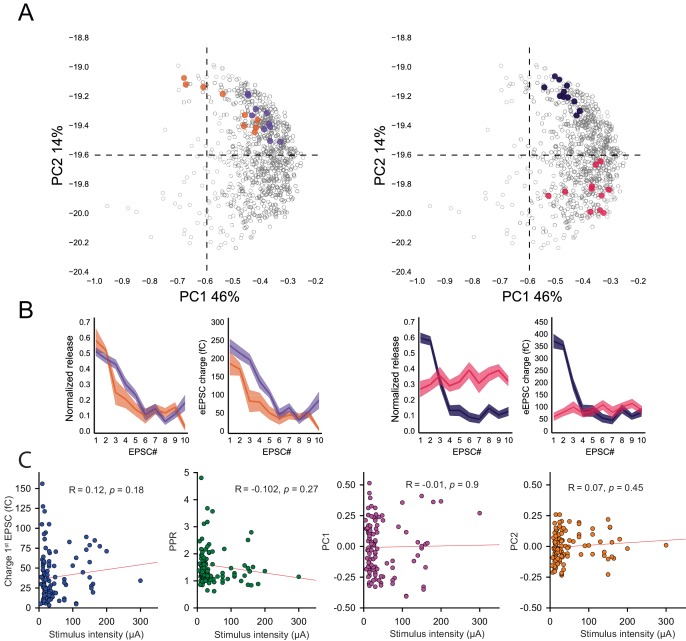
Figure 2—figure supplement 2. Robustness of intrinsic STP evoked by 100 Hz train at unitary GC-MLI synapses.

Figure 2—figure supplement 2.

(A) Functional mapping of synaptic responses recorded during 100 Hz trains in 99 neurons (See Materials and methods). PCA transformation are computed independently for each train (n > 1000) based on the charge value of each EPSC in the train. Consecutive recordings from the same synaptic terminals are represented with the same color code (orange, purples blue or pink points). Note that these recordings are located in a very specific position inside the cloud of points indicating that the profile of STP is conserved during successive stimulation at 100 Hz of the same synaptic input. (B) Normalized EPSC charges plotted against the stimulus number for responses highlighted in A (same color code). Left panel, synaptic responses from synapses with the same behavior during 100 Hz train are clustered nearby inside the PCA transform. Right panel, synaptic responses from synapses with distinct behaviors during 100 Hz trains are positioned at distant positions in the PCA transform. (C) STP profile was not skewed by changes in PF excitability in minimal stimulation experiments. Potentially, high current values can recruit additional PFs during trains and low current values can be associated with failures of PF excitation. These non-synaptic phenomena can induce unexpected changes in the profile of STP. However, neither charges of EPSC at the first stimuli (blue points), PPR (green points), PC1 (purple point) or PC2 (orange points) could be correlated with stimulus intensities. The lack of valid relationships between these parameters and current intensity indicated that in the vast majority of experiments, STP profile was shaped by synaptic mechanisms rather than change in PF excitability.
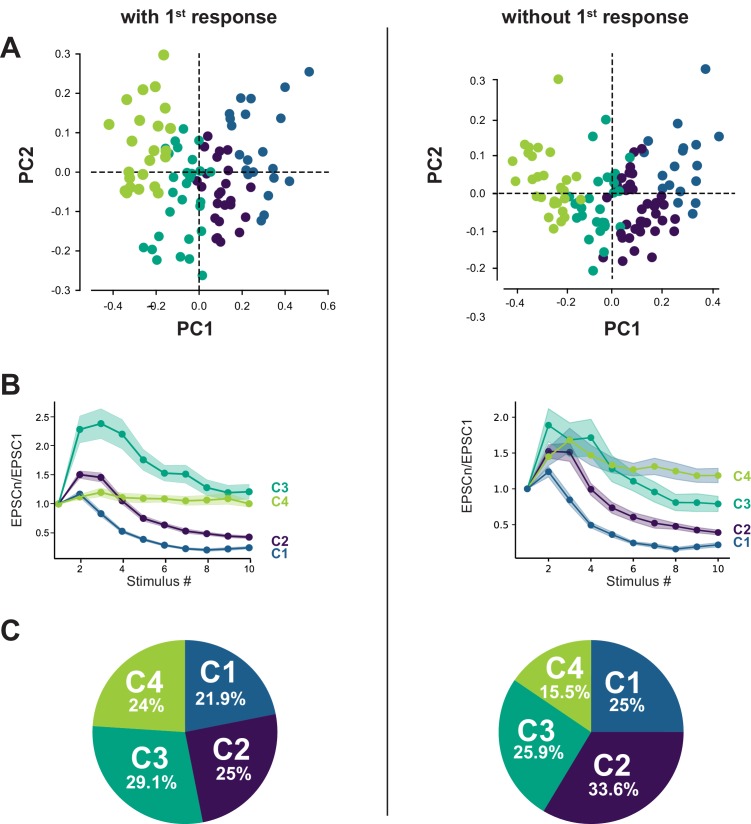
Figure 2—figure supplement 3. The classification of GC-MLI synapses using PCA transformation followed by k-means clustering analysis was weakly impacted by the first response.

Figure 2—figure supplement 3.

(A) Scatter plot of PC1 and PC2 obtained by analyzing EPSC properties during 100 Hz train in WT mice (n = 96) either by taking in account the first response (left, same dataset as in Figure 2) or without taking in account the first response in the train (right). (B) Corresponding mean values of normalized EPSC amplitudes during 100 Hz train according to the four categories of inputs for both types of analysis. (C) Corresponding circular diagrams representing the relative proportion of each category for each type of analysis.