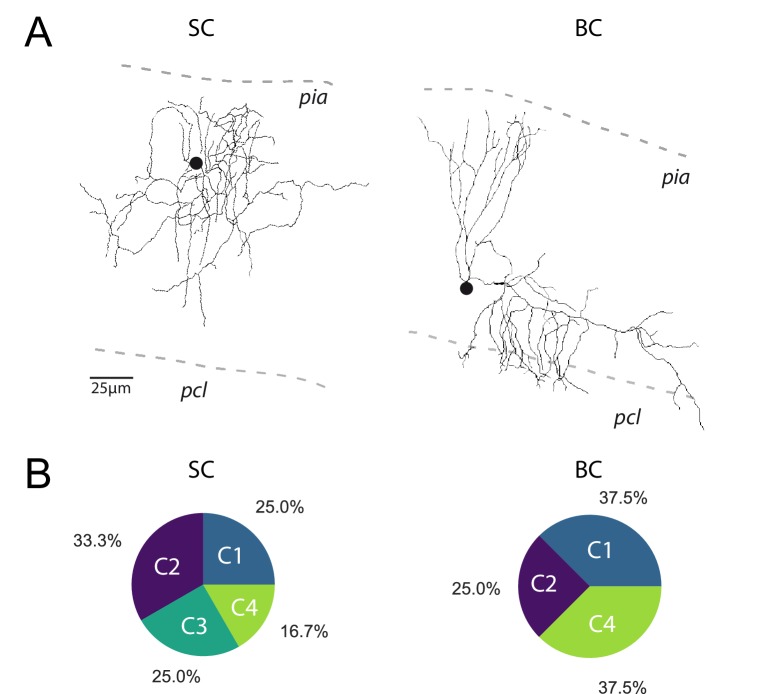
Figure 3. The profile of STP is not determined by the target cell.
(A) Post-hoc reconstruction of 2 recorded MLI using a two-photon microscope. SCs were identified by the absence of neuronal process reaching the PCL (left MLI) and by the absence of cut processes (transection of neuronal processes could be clearly identified by swelling at the tip end portion of processes). At the opposite, BCs were identified by the presence of processes entering in the PCL (right MLI). (B) Circular diagrams of the relative proportion of each category of input (determined by k-means clustering analysis during ten minimal stimulation of GC unitary inputs at 100 Hz) contacting BCs and SCs.


