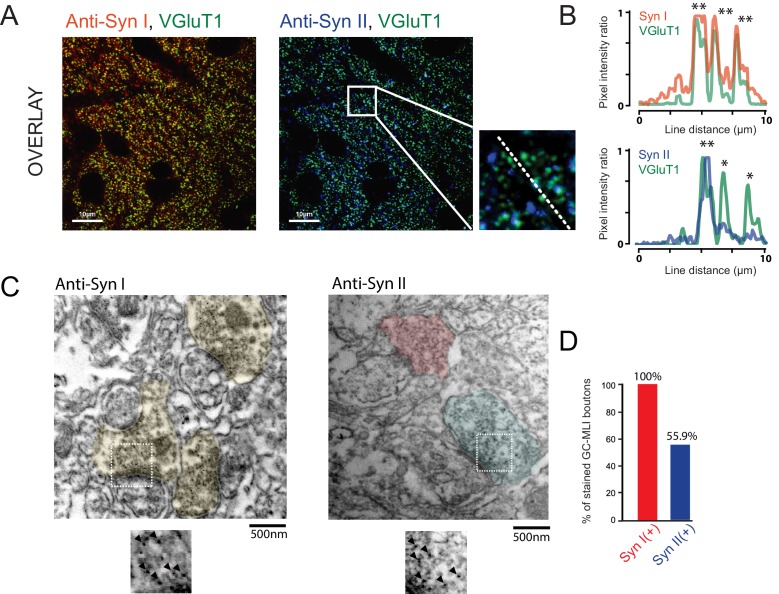
Figure 4. Heterogeneous expression of Syn II at GC-MLI synapses.
(A) Representative merged images of VGluT1/Syn I immunostaining (left image, green and red puncta, respectively) or VGluT1/Syn II immunostaining (right image, green and blue puncta, respectively). The two merged imaged were captured in the molecular layer from the same parasagittal cerebellar section. (B) Profile plot (dashed line in A) showing the colocalization of VGluT1 with Syn I in the majority of VGluT1 puncta while there was only a partial colocalization of VGluT1 with Syn II in VGluT1 puncta. (C) Typical immunogold electron micrographs illustrating the ubiquitous expression of Syn I in GC boutons contacting MLIs (left micrograph) and the heterogeneous expression of Syn II in these boutons (right micrograph). GC boutons contacting MLIs were colorized. Insets corresponding to magnifications of areas delimited by white squares show details of immunogold staining. (D) Histogram of the percentage of GC-MLI synapse positive for Syn I (red bar) and Syn II (blue bar).

