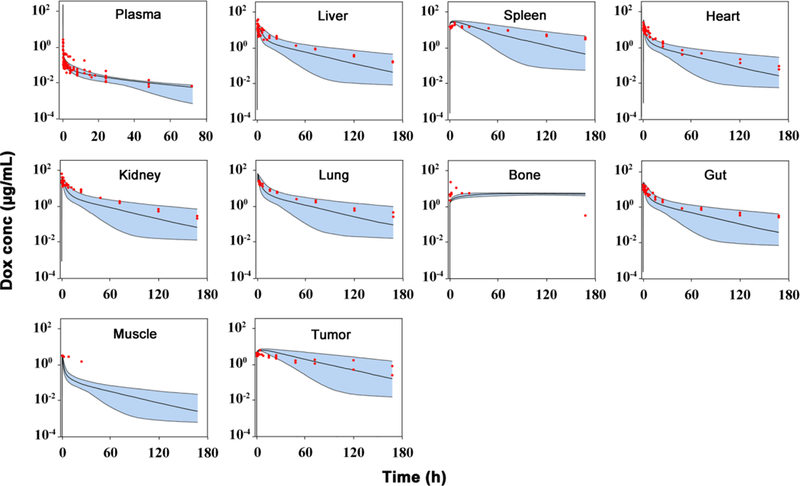
Fig 2.

Observed and predicted doxorubicin (Dox) concentration-time profiles in plasma and various tissues in mice. Observed data are shown as dots. Solid lines are the predicted median, dashed lines represent the predicted 5th and 95th percentiles, and the shaded areas depict the 5th−95th percentile population prediction intervals. (Supplemental materials reference 1–9)
