
Fig 7.
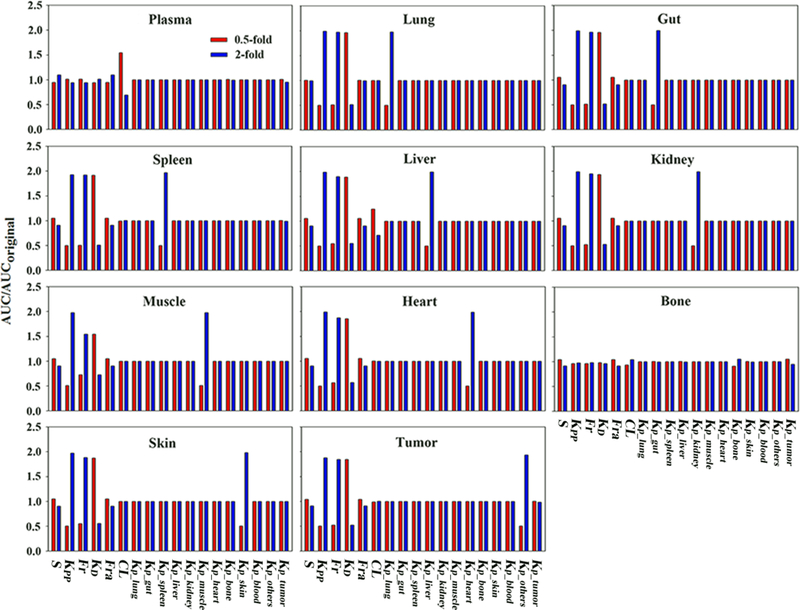
Parameter sensitivity analysis results. Simulations were performed with the parameter varied 0.5-or 2-fold of the original values. The ratio of altered AUC versus original AUC was used to evaluate parameter sensitivity. Tissue AUC was normalized by plasma AUC to indicate changes of tissue distribution extent.