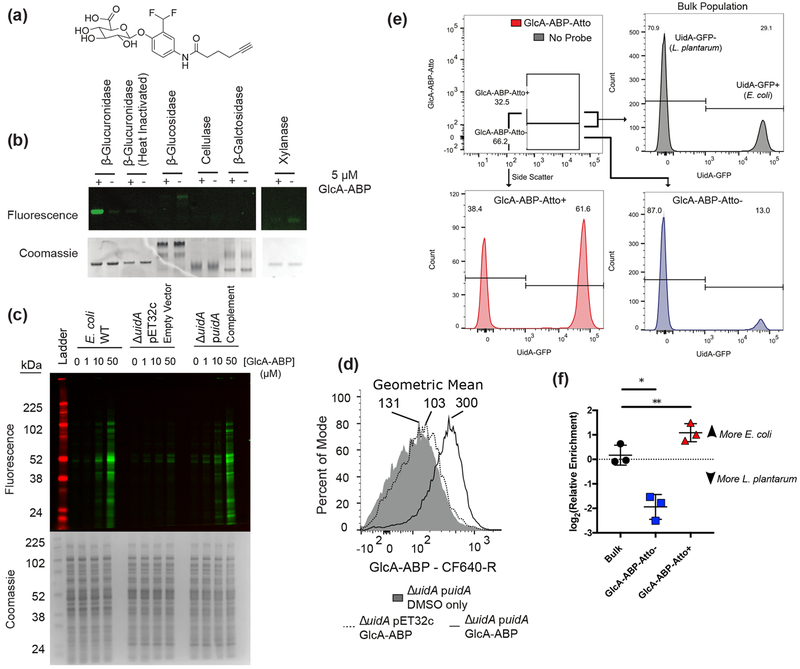
Figure 1.
GlcA-ABP labels β-glucuronidase-active proteins and cells. (a) GlcA-ABP. (b) Selectivity of GlcA-ABP against a panel of glycosidases. (c) GlcA-ABP labeling of E. coli lysates. (d) Whole cell E. coli were labeled with GlcA-ABP and tagged with CF640-R and sorted. Geometric mean is reported above each population. (e) Mixture of L. plantarum and E. coli::pUidA-GFP labeled with GlcA-ABP-Atto. Numbers represent percent of the population in the UidA-GFP− and UidA-GFP+ gates. (f) DNA from sorted cells was used as template for quantitative PCR to determine the relative abundance of E. coli and L. plantarum in the sorted fractions. Lines and error bars represent the mean and standard error of the mean, respectively. * p = 0.0374; ** p = 0.0093 by repeated measures one-way ANOVA with Tukey’s multiple comparisons test, n = 3.

