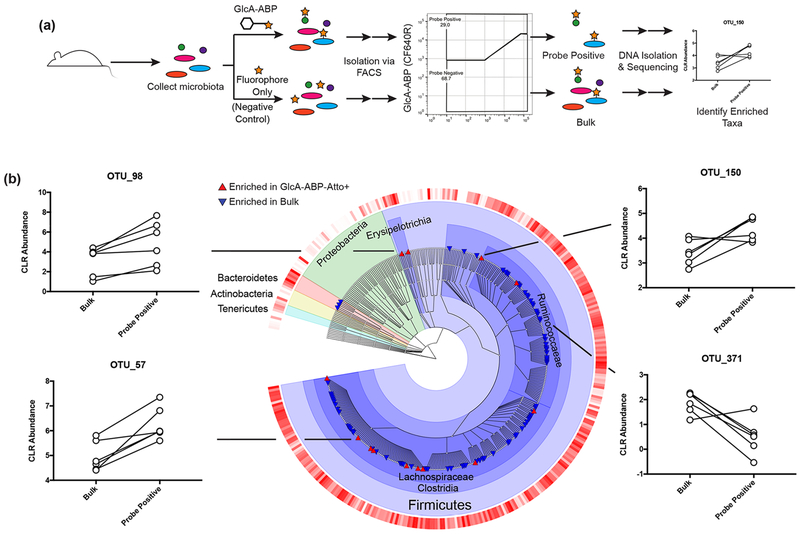
Figure 2.
ABP-FACS identifies β-glucuronidase-active taxa in the gut microbiota. (a) Experimental design. (b) Phylogenetic distribution of taxa enriched or depleted in the GlcA-ABP-Atto+ and bulk populations. The outer ring indicates centered log-ratio abundance, where darker red indicates higher abundance. Taxa with significantly increased or decreased abundance in the ABP+ population are shown by triangles. Centered-log-ratio (CLR) normalized abundances of three GlcA-ABP-Atto enriched taxa (left and top right) and one GlcA-ABP-Atto depleted taxon (bottom right) are shown. Lines connect populations from the same sample. Taxa are differentially abundant where Benjamini–Hochberg adjusted p < 0.05 using a generalized linear model (n = 6).

