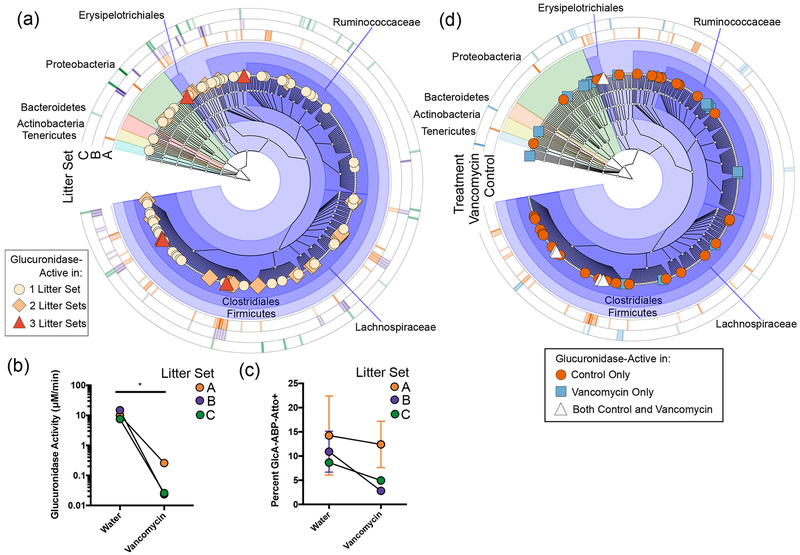
Figure 3.
ABP-FACS can detect interindividual variability. (a) Taxa that were 2-fold enriched in the GlcA-ABP-Atto+ population from each litter were identified (n = 2 mice per Litter Set). Outer rings indicate relative fold enrichment (darker = more enriched) for Litter Sets. Glucuronidase activity (b) and percent GlcA-ABP-Atto+ population (c) in gut microbiota of control (Water) or vancomycin-treated mice. Paired groups of two littermates (n = 3 groups of 2) are connected by lines. * p = 0.0386 by two-sided paired Student’s t test. Data are the average of the two littermates per condition. Error bars represent standard error of the mean. (d) Taxa that were 2-fold enriched in the GlcA-ABP-Atto+ population from either control or vancomycin-treated mice from Litter Set A are shown (n = 2 littermates per condition). Outer rings indicate relative fold enrichment (darker = more enriched) for either control or vancomycin-treated mice.

