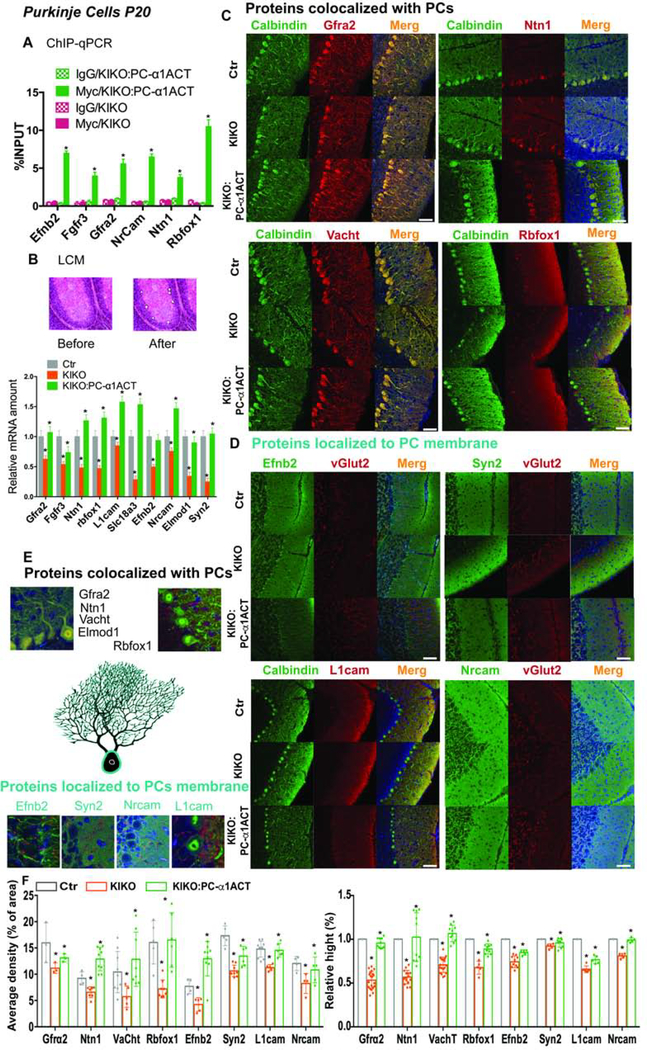
Figure 3: α1ACT regulates target gene expression in PCs.
(A) Quantification of α1ACT target gene DNAs in PCs among mice with and without PC-specific α1ACT expression by ChIP-qPCR (n=6, p<0.005).
(B) LCM and qRT-PCR to quantify target gene mRNA expression in PCs from mouse cerebellum. Upper: images of cerebellar cortex before and after PC LCM. Lower: quantitation of target genes. (n=6, p<0.005).
(C and D) Immunofluorescence staining of target gene protein expression in PCs from mouse cerebellum.
(E) Enlarged view of target gene expression in PCs.
(F) Quantification of immunofluorescence staining signals of target gene protein expression (n=6, p<0.05).
The scale bar represent 50μm (C,D). Values are represented as mean±SEM. *p<0.05.

