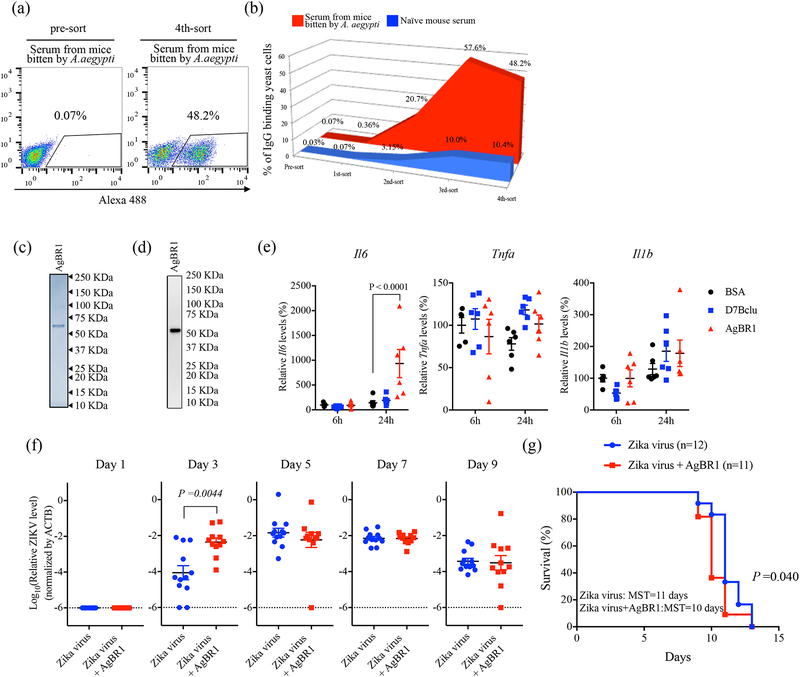
Figure 1. AgBR1 is identified as an antigenic protein in mice and modulates host responses in vitro and in vivo.
(a-b) Yeast surface display (YSD) approach to identify mosquito proteins eliciting responses in mice bitten by Aedes aegypti. Flow cytometry (FACS) analysis of yeast cells using IgG from mice bitten repeatedly by mosquitoes (red) and IgG derived from naïve mouse serum (blue) of transformed yeast cells (left panel:pre-sort, right panel; 4th-sort). The percentages of IgG-binding yeast cells are shown in the right panel of Fig. 1A. Data are representative of two independent experiments with similar results. (c) Recombinant AgBR1 (0.25 μg protein) was run on SDS-PAGE and stained with Coomassie Brilliant Blue. (d) AgBR1 protein was detected using an anti-His antibody. (c-d) Data are representative of two independent experiments. (e) The expression levels of Il6, Tnfa and Il1b after BSA, D7Bclu or AgBR1 treatment. Data were analyzed by two-way ANOVA. n=5 or 6 biologically independent samples pooled from two separate experiments. Data are presented as mean ± s.e.m. (f) Zika virus level in blood after co-inoculation of Zika virus with AgBR1 protein (5.1 μM, 10 μg in 40 μl). Data are presented as mean ± s.e.m. Each data point represents one mouse. Normalized viral RNA levels were analyzed using the two-sided Wilcoxon–Mann–Whitney test. (Zika virus: n=12, Zika virus + AgBR1: n=11 pooled from two separate experiments) (g) Survival and median survival time (MST) were assessed using the Gehan-Wilcoxon test. (Zika virus: n=12, Zika virus + AgBR1: n=11 pooled from in two separate experiments)

