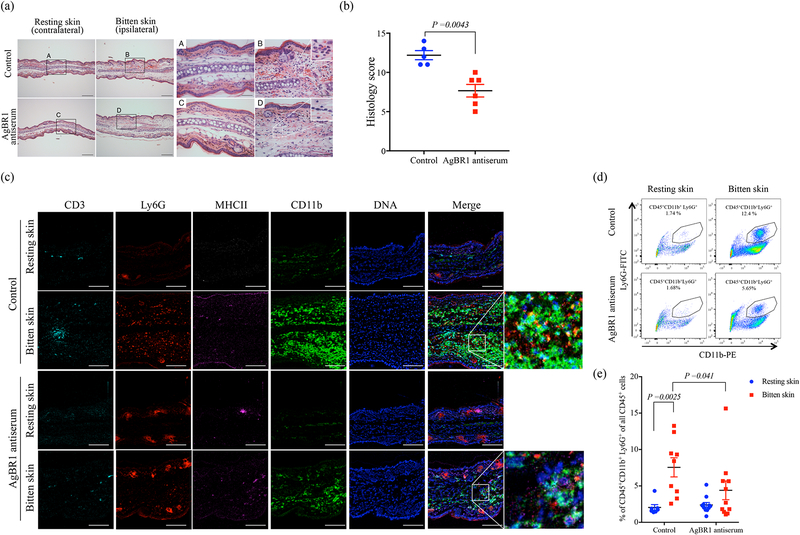
Figure 3. AgBR1 antiserum suppresses neutrophil infiltration at the mosquito bite site.
(a) Hematoxylin and eosin staining of the ears of mice treated with AgBR1 antiserum or control serum at 24 h post-feeding. Scale bar, 200 μm (left panels) and 50 μm (right panels). Data are representative of two independent experiments with similar results. (b) The total histology scores of the bite sites were compared between the AgBR1 antiserum and control group. Data are presented as mean ± s.e.m.. Statistical analysis was performed using two-sided Wilcoxon–Mann–Whitney test. n=5 (Control) or 6 (AgBR1 antiserum) biologically independent samples pooled from two separate experiments. (c) Imaging Mass Cytometry (IMC) labeling of ears of mice 24 h post Zika virus-infected mosquito feeding. Scale bar, 100 μm. Data are representative of two independent experiments with similar results. (d) The population of CD45+CD11b+Ly6G+ (neutrophils) was analyzed using flow cytometry. Data are representative of two independent experiments with similar results. (e) The percent of CD45+CD11b+Ly6G+ (neutrophils) cells in CD45+ leukocyte cells at 24h after Zika virus-infected mosquito feeding. Each dot represents one mouse. Significance was calculated using a two-way ANOVA test for multiple comparisons. Data are presented as mean ± s.e.m.. (Control-resting skin: n=7, Control-bitten skin: n=9, AgBR1 antiserum-resting skin: n=11, AgBR1 antiserum-bitten skin: n=11 biologically independent samples pooled from two separate experiments.)

