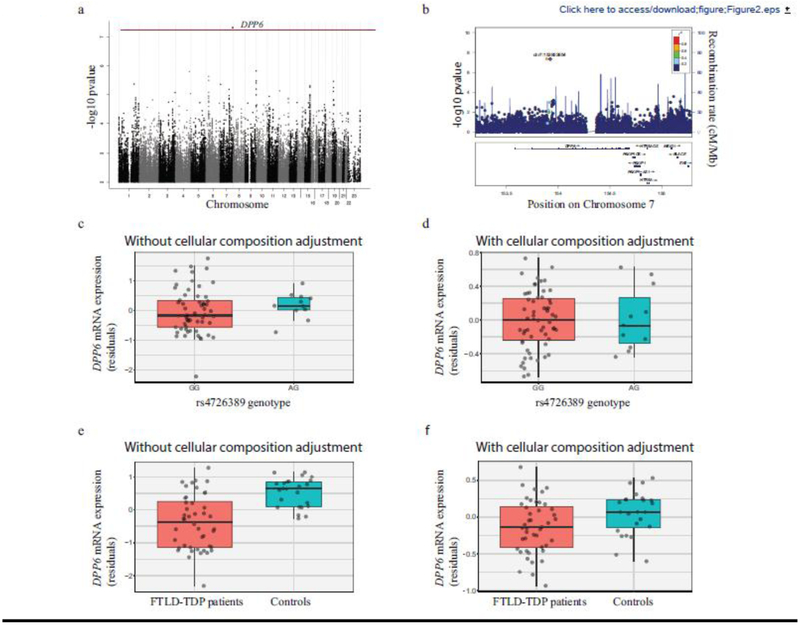
Figure 2. Common variant whole genome sequencing association study and DPP6 locus.
(a) Manhattan plot of the FTLD-TDP patients versus control association study. The red dotted line represents the genome-wide significance level (p=5e-08). (b)Regional association (locus zoom) plot of the DPP6 locus. Each dot represents a genotyped variant. The purple dot is the most significant variant (rs4726389) among variants in the region. Dots are colored from red to blue according to their r2 value, showing their degree of linkage disequilibrium with rs4726389 (grey indicates an r2 of zero). The light blue line shows the estimated recombination rate. (c) DPP6 mRNA expression levels in function of the rs4726389 genotypes without correction for cellular composition in custom RNAseq frontal cortex dataset. (d) DPP6 mRNA expression levels in function of the rs4726389 genotypes with correction for cellular composition in custom RNAseq frontal cortex dataset. (e) Differential DPP6 mRNA expression levels in FTLD-TDP patients and controls without correction for cellular composition. (f) Differential DPP6 mRNA expression levels in FTLD-TDP patients and controls with correction for cellular composition.

